
Page 225 - Proceeding of Atrans Young Researcher's Forum 2019_Neat
P. 225
“Transportation for A Better Life:
Smart Mobility for Now and Then”
23 August 2019, Bangkok, Thailand
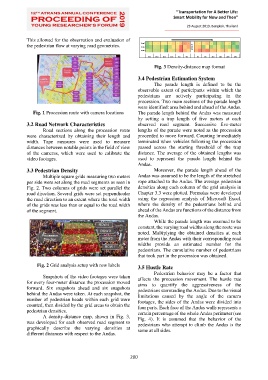
This allowed for the observation and evaluation of
the pedestrian flow at varying road geometries. Row 1 ANDAS
Row 2
Row 3
24m 20m 16m 12m 8m 4m 4m 8m 12m 16m 20m 24m
Fig. 3 Density-distance map format
3.4 Pedestrian Estimation System
The parade length is defined to be the
observable extent of participants within which the
pedestrians are actively participating in the
procession. Two main sections of the parade length
were identified: area behind and ahead of the Andas.
Fig. 1 Procession route with camera locations The parade length behind the Andas was measured
by setting a trap length of five meters at each
3.2 Road Network Characteristics observed road segment. Successive five-meter
Road sections along the procession route lengths of the parade were noted as the procession
were characterized by obtaining their length and proceeded to move forward. Counting immediately
width. Tape measures were used to measure terminated when vehicles following the procession
distances between notable points in the field of view passed across the starting threshold of the trap
of the cameras, which were used to calibrate the distance. The average of the obtained lengths was
video footages. used to represent the parade length behind the
Andas.
3.3 Pedestrian Density Moreover, the parade length ahead of the
Multiple square grids measuring two meters Andas was assumed to be the length of the stretched
per side were set along the road segments as seen in rope attached to the Andas. The average pedestrian
Fig. 2. Two columns of grids were set parallel the densities along each column of the grid analysis in
road direction. Several grids were set perpendicular Chapter 3.3 were plotted. Formulas were developed
the road direction to an extent where the total width using the regression analysis of Microsoft Excel,
of the grids was less than or equal to the road width where the density of the pedestrians behind and
of the segment. ahead of the Andas are functions of the distance from
the Andas.
While the parade length was assumed to be
constant, the varying road widths along the route was
noted. Multiplying the obtained densities at each
meter from the Andas with their corresponding road
widths provide an estimated number for the
pedestrians. The cumulative number of pedestrians
that took part in the procession was obtained.
Fig. 2 Grid analysis setup with row labels 3.5 Hustle Rate
Pedestrian behavior may be a factor that
Snapshots of the video footages were taken affects the procession movement. The hustle rate
for every four-meter distance the procession moved aims to quantify the aggressiveness of the
forward. Six snapshots ahead and six snapshots pedestrians surrounding the Andas. Due to the visual
behind the Andas were taken. At each snapshot, the limitations caused by the angle of the camera
number of pedestrian heads within each grid were footages, the sides of the Andas were divided into
counted, then divided by the grid areas to obtain the four parts. Each face of the Andas walls represents a
pedestrian densities. certain percentage of the whole Andas perimeter (see
A density-distance map, shown in Fig. 3, Fig. 4). It is assumed that the behavior of the
was developed for each observed road segment to pedestrians who attempt to climb the Andas is the
graphically describe the varying densities at same at all sides.
different distances with respect to the Andas.
200