
Page 229 - Proceeding of Atrans Young Researcher's Forum 2019_Neat
P. 229
“Transportation for A Better Life:
Smart Mobility for Now and Then”
23 August 2019, Bangkok, Thailand
according to the first assumption.
For the first 130 meters of the procession route that
was occupied by the pedestrians, the number of
devotees participating in the procession was
estimated using Eq. 5. Considering the varying road
widths of the procession route, the number of
devotees within the first 130 meters of the route was
estimated to be about 21,801 pedestrians. As the
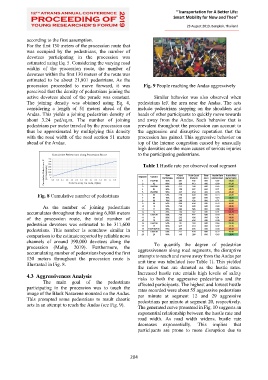
procession proceeded to move forward, it was Fig. 9 People reaching the Andas aggressively
perceived that the density of pedestrians joining the
active devotees ahead of the parade was constant. Similar behavior was also observed when
The joining density was obtained using Eq. 4, pedestrians left the area near the Andas. The acts
considering a length of 51 meters ahead of the include pedestrians stepping on the shoulders and
Andas. This yields a joining pedestrian density of heads of other participants to quickly move towards
about 3.24 ped/sq.m. The number of joining and away from the Andas. Such behavior that is
pedestrians per meter traveled by the procession can prevalent throughout the procession can account to
thus be approximated by multiplying this density the aggressive and disruptive reputation that the
with the road width of the road section 51 meters procession has gained. This aggressive behavior on
ahead of the Andas. top of the intense congestion caused by unusually
high densities are the main causes of serious injuries
to the participating pedestrians.
Table 1 Hustle rate per observed road segment
View Count Total Count Time Hustle Rate Hustle Rate
Segment Camera
Percentage (Person) (Person) (sec) (person/sec) (person/min)
1 01A/01B 50% 201 402 600 0.67 40.20
02
2 3 03A/03B 80% 330 413 600 0.69 41.30
390
312
600
0.65
39.00
80%
4 5 05A/05B 30% 128 427 600 0.71 42.70
04
454
227
45.40
0.76
600
50%
Fig. 8 Cumulative number of pedestrians 6 7 06 50% 220 440 600 0.73 44.00
07
70%
32.20
600
0.54
322
225
8 9 08 70% 298 426 600 0.71 42.60
09
45.80
0.76
229
50%
600
458
As the number of joining pedestrians 10 10 50% 240 480 600 0.80 48.00
263
50%
11
526
52.60
0.88
600
11
accumulates throughout the remaining 6,808 meters 12 13A/13B 30% 164 547 600 0.91 54.70
12
47.20
13
0.79
472
236
600
50%
of the procession route, the total number of 14 14 50% 243 486 600 0.81 48.60
15
482
15
0.80
385
600
48.20
80%
pedestrian devotees was estimated to be 311,600 16 16A/16B 50% 197 394 600 0.66 39.40
434
17
600
43.40
50%
17
217
0.72
pedestrians. This number is somehow similar in 18 18A/18B/18C 50% 248 496 600 0.83 49.60
19A/19B
0.72
600
43.40
50%
434
217
19
comparison to the estimate reported by reliable news 20 20 50% 145 290 600 0.48 29.00
channels of around 390,000 devotees along the To quantify the degree of pedestrian
procession (Malig, 2019). Furthermore, the
accumulating number of pedestrians beyond the first aggressiveness along road segments, the disruptive
130 meters throughout the procession route is attempts to reach and move away from the Andas per
unit time was tabulated (see Table 1). This yielded
illustrated in Fig. 8.
the ratios that are denoted as the hustle rates.
Increased hustle rate entails high levels of safety
4.3 Aggressiveness Analysis risks to both the aggressive pedestrians and the
The main goal of the pedestrians affected participants. The highest and lowest hustle
participating in the procession was to touch the rates recorded were about 55 aggressive pedestrians
image of the Black Nazarene mounted on the Andas. per minute at segment 12 and 29 aggressive
This prompted some pedestrians to result chaotic pedestrians per minute at segment 20, respectively.
acts in an attempt to reach the Andas (see Fig. 9). The generated curve presented in Fig. 10 suggests an
exponential relationship between the hustle rate and
road width. As road width widens, hustle rate
decreases exponentially. This implies that
participants are prone to more disruption due to
204