
Page 230 - Proceeding of Atrans Young Researcher's Forum 2019_Neat
P. 230
“Transportation for A Better Life:
Smart Mobility for Now and Then”
23 August 2019, Bangkok, Thailand
aggressive fellow participants on segments where
the road widths are narrow.
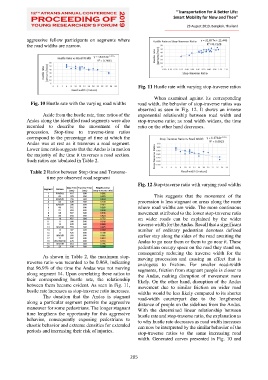
Fig. 11 Hustle rate with varying stop-traverse ratios
When examined against its corresponding
Fig. 10 Hustle rate with the varying road widths road width, the behavior of stop-traverse ratios was
observed as seen in Fig. 12. It shows an inverse
Aside from the hustle rate, time ratios of the exponential relationship between road width and
Andas along the identified road segments were also stop-traverse ratio; as road width widens, the time
recorded to describe the movement of the ratio on the other hand decreases.
procession. Stop-time to traverse-time ratios
correspond to the percentage of time at which the
Andas was at rest as it traverses a road segment.
Lower time ratio suggests that the Andas is in motion
the majority of the time it traverses a road section.
Such ratios are tabulated in Table 2.
Table 2 Ratios between Stop-time and Traverse-
time per observed road segment
Fig. 12 Stop-traverse ratio with varying road widths
Stop Time Traverse Time Stop/Traverse
Segment Camera
(sec) (sec) (stop-traverse ratio)
1 01A/01B 415 600 0.692
2 02 375 600 0.625 This suggests that the movement of the
3 03A/03B 296 600 0.494
4 04 449 600 0.748 procession is less stagnant on areas along the route
5 05A/05B 396 600 0.661
6 06 372 600 0.620 where road widths are wide. The more continuous
7 07 269 600 0.448
8 08 507 600 0.845 movement attributed to the lower stop-traverse ratio
9 09 494 600 0.824
10 10 452 600 0.753 on wider roads can be explained by the wider
11 11 506 600 0.843
12 12 570 600 0.950 traverse width for the Andas. Recall that a significant
13 13A/13B 555 600 0.925
14 14 582 600 0.969 number of ordinary pedestrian devotees defined
15 15 425 600 0.708
16 16A/16B 399 600 0.665 earlier stay along the sides of the road awaiting the
17 17 487 600 0.812
18 18A/18B/18C 476 600 0.793 Andas to go near them or them to go near it. These
19 19A/19B 453 600 0.755
20 20 180 600 0.300 pedestrians occupy space on the road they stand on,
consequently reducing the traverse width for the
As shown in Table 2, the maximum stop- moving procession and causing an effect that is
traverse ratio was recorded to be 0.969, indicating analogous to friction. For smaller road-width
that 96.9% of the time the Andas was not moving segments, friction from stagnant people is closer to
along segment 14. Upon correlating these ratios to the Andas, making disruption of movement more
their corresponding hustle rate, the relationship likely. On the other hand, disruption of the Andas
between them became evident. As seen in Fig. 11, movement due to similar friction on wider road
hustle rate increases as stop-traverse ratio increases. widths would be less likely compared to its shorter
The duration that the Andas is stagnant road-width counterpart due to the lengthened
along a particular segment permits the aggressive distance of people on the sidelines from the Andas.
maneuver for some pedestrians. The longer stagnant With the determined linear relationship between
time lengthens the opportunity for this aggressive hustle rate and stop-traverse ratio, the explanation as
behavior, consequently exposing pedestrians to to why hustle rate decreases as road width increases
chaotic behavior and extreme densities for extended can now be interpreted by the similar behavior of the
periods and increasing their risk of injuries. stop-traverse ratios to the same increasing road
width. Generated curves presented in Fig. 10 and
205