
Page 222 - Proceeding of Atrans Young Researcher's Forum 2019_Neat
P. 222
“Transportation for A Better Life:
Smart Mobility for Now and Then”
23 August 2019, Bangkok, Thailand
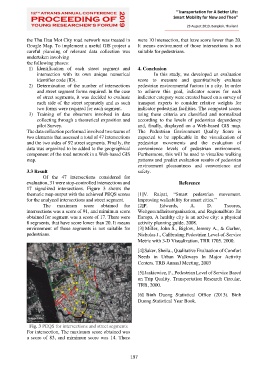
the Thu Dau Mot City road network was treated in were 10 intersection, that have score lower than 20.
Google Map. To implement a useful GIS project a It means environment of those intersections is not
careful planning of relevant data collection was suitable for pedestrians.
undertaken involving
the following phases:
1) Identification of each street segment and 4. Conclusion
intersection with its own unique numerical In this study, we developed an evaluation
identifier code (ID). score to measure and quantitatively evaluate
2) Determination of the number of intersections pedestrian environmental factors in a city. In order
and street segment forms required. In the case to achieve this goal, indicator scores for each
of street segments, it was decided to evaluate indicator category were created based on a survey of
each side of the street separately and as such transport experts to consider relative weights for
two forms were required for each segment. indicator pedestrian facilities. The computed scores
3) Training of the observers involved in data using these criteria are classified and normalized
collecting through a theoretical exposition and according to the levels of pedestrian dependency
pilot Survey. and, finally, displayed on a Web-based GIS map.
The data collection performed involved two teams of The Pedestrian Environment Quality Score is
two elements that assessed a total of 47 intersections expected to be applicable in the visualization of
and the two sides of 92 street segments. Finally, the pedestrian movements and the evaluation of
data was organized to be added to the geographical convenience levels of pedestrian environment.
component of the road network in a Web-based GIS Furthermore, this will be used to visualize walking
map. patterns and predict evaluation results of pedestrian
environment pleasantness and convenience and
3.3 Result safety.
Of the 47 intersections considered for
evaluation, 31 were stop-controlled intersections and Reference
17 signalized intersections. Figure 3 shows the
thematic map output with the achieved PEQS scores [1]V. Raipat, “Smart pedestrian movement.
for the analyzed intersections and street segment. Improving walkability for smart cities.”
The maximum score obtained for [2]P. Edwards, A. D. Tsouros,
intersections was a score of 91, and mimimun score Weltgesundheitsorganisation, and Regionalbüro für
obtained for segment was a score of 17. There were Europa, A healthy city is an active city: a physical
8 segments, that have score lower than 20. It means activity planning guide. 2008.
environment of those segments is not suitable for [3] Miller, John S., Biglow, Jeremy A., & Garber,
pedestrians. Nicholas J., Calibrating Pedestrian Level-of-Service
Metric with 3-D Visualization, TRR 1705. 2000.
[4] Saker, Sheila., Qualitative Evaluation of Comfort
Needs in Urban Walkways In Major Activity
Centers. TRB Annual Meeting, 2003
[5] Jaskiewicz, F., Pedestrian Level of Service Based
on Trip Quality. Transportation Research Circular,
TRB, 2000.
[6] Binh Duong Statistical Office (2013). Binh
Duong Statistical Year Book.
Fig. 3 PEQS for intersections and street segments
For intersection, The maximum score obtained was
a score of 83, and mimimun score was 14. There
197