
Page 236 - Proceeding of Atrans Young Researcher's Forum 2019_Neat
P. 236
“Transportation for A Better Life:
Smart Mobility for Now and Then”
23 August 2019, Bangkok, Thailand
about how many data samples were needed. The true After gathering all the primary sources data
basis of the sample size required is when the from the On-Board Bus Survey and the P2P
NLOGIT model started to stabilize and when the Interview Survey Questionnaire, all the data were
pseudo r-squared is within 0.2 to 0.4. then input into the NLOGIT Program. The personal
information of the passengers was also prepared for
3.3 Data Collection descriptive analysis.
The researchers first started with the On- 4. Results and Discussion
Board P2P Bus Survey, wherein the researchers were 4.1 On-Board Survey
also the one who accomplished this during the ride
in the P2P Bus. The survey questionnaire acquired
the data about the inflow and outflow of the
passengers per P2P route, the total running time of
the P2P bus, and any special remarks of the trip. The
On-Board P2P Bus Service Survey is essential
because it is through this survey that the researchers
determined the total travel time of the P2P Buses in
all of the available routes in Metro Manila and
compared it with the other modes of transportation
available. This is to accurately represent the number
of commuters in each P2P Bus Route so that the
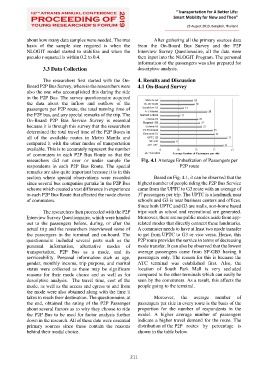
researchers did not over or under sample the Fig. 4.1 Average Embarkation of Passengers per
respondents in each P2P Bus Route. The special P2P route
remarks are also quite important because it is in this
section where special observations were recorded Based on Fig. 4.1, it can be observed that the
since several bus companies partake in the P2P Bus highest number of people riding the P2P Bus Service
scheme which created a vast difference in experience came from the UPTC to G3 route with an average of
in each P2P Bus Route that affected the mode choice 37 passengers per trip. The UPTC is a landmark near
of commuters. schools and G3 is near business centers and offices.
Since both UPTC and G3 are malls, non-home based
The researchers then proceeded with the P2P trips such as school and recreational are generated.
Interview Survey Questionnaire, which were handed Moreover, there are no public modes aside from app-
out to the passengers before, during, or after the related modes that directly connect these landmarks.
actual trip and the researchers interviewed some of A commuter needs to have at least two mode transfer
the passengers in the terminal and on-board. The to get from UPTC to G3 or vice versa. Hence, this
questionnaire included several parts such as the P2P route provides the service in terms of decreasing
personal information, alternative modes of mode transfer. It can also be observed that the lowest
transportation, P2P Bus as a mode, and its average passengers came from SP-GB5 having 8
serviceability. Personal information such as age, passengers only. The reason for this is because the
gender, monthly income, trip purpose, and marital ATC terminal was established first. Also, the
status were collected as these may be significant location of South Park Mall is very secluded
reasons for their mode choice and as well as for compared to the other terminals which can easily be
descriptive analysis. The travel time, cost of the seen by the commuters. As a result, this affects the
mode, as well as the access and egress to and from people going to the terminal.
the mode were also obtained along with the time it
takes to reach their destination. The questionnaire, at Moreover, the average number of
the end, obtained the rating of the P2P Passenger passengers per ride in every route is the basis of the
about several factors as to why they choose to ride proportion for the number of respondents in the
the P2P Bus to be used for factor analysis further model. A higher average number of passengers
down in the research. All of these data were essential indicate a higher travel demand for the route. The
primary sources since these contain the reasons distribution of the P2P routes by percentage is
behind their modal choice. shown in the table below.
211