
Page 239 - Proceeding of Atrans Young Researcher's Forum 2019_Neat
P. 239
“Transportation for A Better Life:
Smart Mobility for Now and Then”
23 August 2019, Bangkok, Thailand
maximum passenger rule is being applied. This also
affects the travel cost since service quality is a
contributing factor. This results to public modes
having lower fare compared to Grab and P2P.
It can also be observed that even if private
vehicles have the lowest travel time, Grab and other
app-related modes have the highest cost. Aside from
the fuel cost of the mode, the service of the employee
as the driver to the passenger contributes to the
increase in cost. Moreover, the demand for the mode
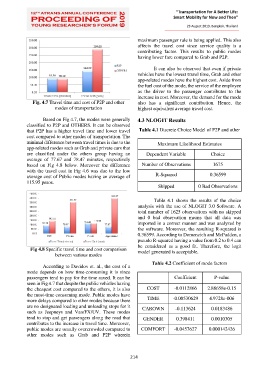
Fig. 4.7 Travel time and cost of P2P and other also has a significant contribution. Hence, the
modes of transportation highest equivalent average travel cost.
Based on Fig 4.7, the modes were generally 4.3 NLOGIT Results
classified to P2P and OTHERS. It can be observed
that P2P has a higher travel time and lower travel Table 4.1 Discrete Choice Model of P2P and other
cost compared to other modes of transportation. The
minimal difference between travel times is due to the Maximum Likelihood Estimates
app-related modes such as Grab and private cars that
are classified under the others group having an Dependent Variable Choice
average of 77.67 and 78.47 minutes, respectively
based on Fig 4.8 below. Moreover the difference Number of Observations 1675
with the travel cost in Fig 4.6 was due to the low
average cost of Public modes having an average of R-Squared 0.36599
115.95 pesos.
Skipped 0 Bad Observations
Table 4.1 shows the results of the choice
analysis with the use of NLOGIT 3.0 Software. A
total number of 1625 observations with no skipped
and 0 bad observation means that all data was
imported in a correct manner and was analyzed by
the software. Moreover, the resulting R-squared is
0.36599. According to Domencich and McFadden, a
pseudo R-squared having a value from 0.2 to 0.4 can
be considered as a good fit. Therefore, the logit
Fig 4.8 Specific travel time and cost comparison model generated is acceptable.
between various modes
According to Davidov et. al., the cost of a Table 4.2 Coefficient of mode factors
mode depends on how time-consuming it is since
passengers tend to pay for the time saved. It can be Coefficient P-value
seen in Fig 4.7 that despite the public vehicles having
the cheapest cost compared to the others, it is also COST -0.0112866 2.88658e-0.15
the most-time consuming mode. Public modes have
more delays compared to other modes because there TIME -0.00530629 4.9728e-006
are no designated loading and unloading stops for it CAROWN -0.113624 0.0183486
such as Jeepneys and Van/FX/UV. These modes
tend to stop and get passengers along the road that GENDER 0.398411 0.0010305
contributes to the increase in travel time. Moreover,
public modes are usually overcrowded compared to COMFORT -0.0457627 0.000142426
other modes such as Grab and P2P wherein
214