
Page 42 - Proceeding of Atrans Young Researcher's Forum 2019_Neat
P. 42
“Transportation for A Better Life:
Smart Mobility for Now and Then”
23 August 2019, Bangkok, Thailand
MC 1
110
0.9
100 0.8
90 0.7
Speed (Kph) 70 Stop Propapability of stopping 0.6 MC
80
Go
0.5
60
50
40 0.4 PC
0.3
30 0.2
20
0 10 20 30 40 50 60 70 80 90 100 110 120 130 140 150 0.1
Distance from stopping line (m) 0 0 1 2 3 4 5 6 7 8 9 10 11 12 13
Travel time to stopping line (s)
Fig. 4 The motorcyclist stop/go decision at the
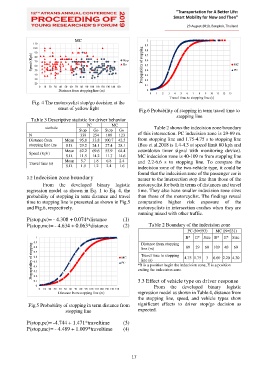
onset of yellow light Fig.6 Probability of stopping in term travel time to
stopping line
Table 3 Descriptive statistic for driver behavior
PC MC
statistic Table 2 shows the indecision zone boundary
Stop Go Stop Go
N 339 254 108 123 of this intersection. PC indecision zone is 29-89 m.
Distance from Mean 95.8 33.8 100.7 42.5 from stopping line and 1.75-4.75 s to stopping line
stopping line (m) S.D. 29.2 24.1 27.4 28.1 (Bao et al.2018 is 1.4-4.3 at speed limit 60 kph and
Mean 62.2 69.6 55.9 64.4 countdown timer signal with monitoring device).
Speed (Kph)
S.D. 11.5 14.2 11.7 14.6 MC indecision zone is 40-109 m from stopping line
Mean 5.7 1.8 6.8 2.4 and 2.2-6.6 s to stopping line. To compare the
Travel time (s)
S.D. 1.9 1.2 2.4 1.6 indecision zone of the two-vehicle type, it could be
found that the indecision zone of the passenger car is
3.2 Indecision zone boundary nearer to the intersection stop line than those of the
From the developed binary logistic motorcyclist for both in terms of distances and travel
regression model as shown in Eq. 1 to Eq. 4, the time. They also have smaller indecision zone sizes
probability of stopping in term distance and travel than those of the motorcyclist. The findings reveal
time to stopping line is presented as shown in Fig.5 comparative higher risk exposure of the
and Fig.6, respectively. motorcyclists in intersection crashes when they are
running mixed with other traffic.
P(stop,pc)= - 4.308 + 0.074*distance (1)
P(stop,mc)= - 4.634 + 0.063*distance (2) Table 2 Boundary of the indecision zone
PC (N=593) MC (N=231)
1 B* E* Size B* E* Size
0.9 Distance from stopping 89 29 60 109 40 69
Propapability of stopping 0.7 MC *B is a position begin the indecision zone, E is a position
0.8
line (m)
Travel time to stopping
0.6
4.75 1.75 3
6.60 2.20 4.30
line (s)
0.5
PC
0.4
ending the indecision zone
0.3
0.2
0.1 3.3 Effect of vehicle type on driver response
0 From the developed binary logistic
0 10 20 30 40 50 60 70 80 90 100 110 120 130 140 150
Distance from stopping line (m) regression model as shown in Table 4, distance from
the stopping line, speed, and vehicle types show
Fig.5 Probability of stopping in term distance from significant effects to driver stop/go decision as
stopping line expected.
P(stop,pc)= -4.744 + 1.471*traveltime (3)
P(stop,mc)= - 4.489 + 1.009*traveltime (4)
17