Page 413 - BSIT Course Syllabus (First Sem 2020-2021)
P. 413

interpret and           D2. t-test
                                   report; and        E. Test on the
                               4. interpret and           Difference of
                                   report the results        Means of Two or
                                   of the analysis.       More
                                                          Populations
                                                          E1. Analysis of
                                                            Variance
                                                      F. Test of
                                                           Independence
                                                           (Chi-Square)
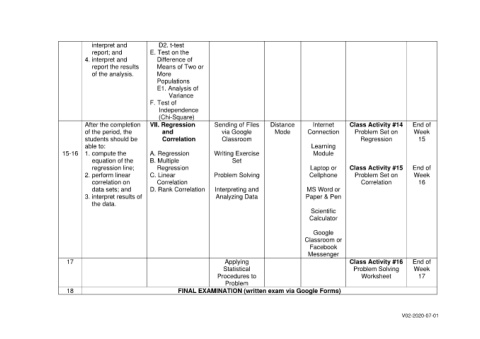
                               After the completion   VII. Regression       Sending of Files    Distance       Internet     Class Activity #14    End of
                               of the period, the            and               via Google        Mode        Connection      Problem Set on       Week
                               students should be            Correlation       Classroom                                       Regression           15
                               able to:                                                                       Learning
                       15-16  1. compute the          A. Regression         Writing Exercise                   Module
                                   equation of the    B. Multiple                 Set
                                   regression line;       Regression                                          Laptop or     Class Activity #15    End of
                               2. perform linear      C. Linear             Problem Solving                   Cellphone      Problem Set on       Week
                                   correlation on         Correlation                                                           Correlation         16
                                   data sets; and     D. Rank Correlation   Interpreting and                 MS Word or
                               3. interpret results of                       Analyzing Data                 Paper & Pen
                                   the data.
                                                                                                              Scientific
                                                                                                              Calculator

                                                                                                               Google
                                                                                                            Classroom or
                                                                                                              Facebook
                                                                                                             Messenger
                        17                                                      Applying                                    Class Activity #16    End of
                                                                               Statistical                                   Problem Solving      Week
                                                                             Procedures to                                      Worksheet           17
                                                                                Problem
                        18                                     FINAL EXAMINATION (written exam via Google Forms)


                                                                                                                                              V02-2020-07-01
   408   409   410   411   412   413   414   415   416   417   418