Page 410 - BSIT Course Syllabus (First Sem 2020-2021)
P. 410
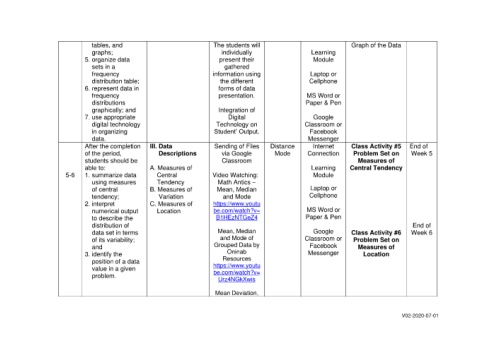
tables, and                              The students will                               Graph of the Data
                                   graphs;                                     individually                   Learning
                               5. organize data                               present their                    Module
                                   sets in a                                    gathered
                                   frequency                                information using                 Laptop or
                                   distribution table;                        the different                   Cellphone
                               6. represent data in                           forms of data
                                   frequency                                  presentation.                  MS Word or
                                   distributions                                                            Paper & Pen
                                   graphically; and                           Integration of
                               7. use appropriate                                Digital                       Google
                                   digital technology                        Technology on                  Classroom or
                                   in organizing                            Student’ Output.                  Facebook
                                   data.                                                                     Messenger
                               After the completion   III. Data             Sending of Files    Distance       Internet     Class Activity #5    End of
                               of the period,              Descriptions        via Google        Mode        Connection      Problem Set on      Week 5
                               students should be                              Classroom                                       Measures of
                               able to:               A. Measures of                                          Learning      Central Tendency
                        5-6    1. summarize data          Central           Video Watching:                    Module
                                   using measures         Tendency           Math Antics –
                                   of central         B. Measures of         Mean, Median                     Laptop or
                                   tendency;               Variation           and Mode                       Cellphone
                               2. interpret           C. Measures of        https://www.youtu
                                   numerical output        Location         be.com/watch?v=                  MS Word or
                                   to describe the                           B1HEzNTGeZ4                    Paper & Pen
                                   distribution of                                                                                                End of
                                   data set in terms                         Mean, Median                      Google       Class Activity #6    Week 6
                                   of its variability;                        and Mode of                   Classroom or     Problem Set on
                                   and                                      Grouped Data by                   Facebook         Measures of
                               3. identify the                                   Oninab                      Messenger          Location
                                   position of a data                          Resources
                                   value in a given                         https://www.youtu
                                                                            be.com/watch?v=
                                   problem.
                                                                              Urz4NGkXwis

                                                                            Mean Deviation,


                                                                                                                                              V02-2020-07-01

