
Page 16 - Development of a Language Translator from English to Waray
P. 16
Khenilyn P. Lewis et al., International Journal of Advanced Trends in Computer Science and Engineering, 9(2), March - April 2020, 1101 – 1106
2.4 Training of the Prediction Model
The models were trained using the Waikato Environment for
Knowledge Analysis (WEKA) and Orange Visual
Programming. The training data set is composed of 2405
instances with 1001 features and the testing data set is
composed of 101 instances with 1001 features using 10-fold
cross validation to avoid overfitting.
2.5 Prediction and Validation
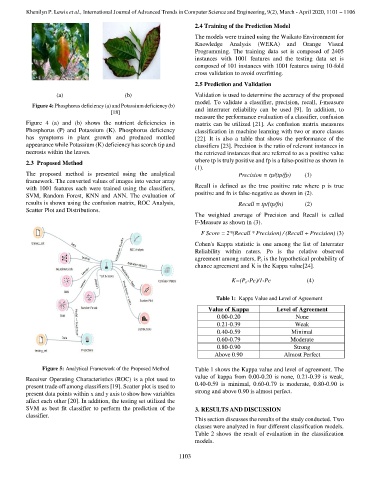
(a) (b) Validation is used to determine the accuracy of the proposed
model. To validate a classifier, precision, recall, f-measure
Figure 4: Phosphorus deficiency (a) and Potassium deficiency (b)
and interrater reliability can be used [9]. In addition, to
[18]
measure the performance evaluation of a classifier, confusion
Figure 4 (a) and (b) shows the nutrient deficiencies in matrix can be utilized [21]. As confusion matrix measures
Phosphorus (P) and Potassium (K). Phosphorus deficiency classification in machine learning with two or more classes
has symptoms in plant growth and produced mottled [22]. It is also a table that shows the performance of the
appearance while Potassium (K) deficiency has scorch tip and classifiers [23]. Precision is the ratio of relevant instances in
necrosis within the leaves. the retrieved instances that are referred to as a positive value
where tp is truly positive and fp is a false-positive as shown in
2.3 Proposed Method
(1).
The proposed method is presented using the analytical Precision = tp/(tp/fp) (1)
framework. The converted values of images into vector array
Recall is defined as the true positive rate where p is true
with 1001 features each were trained using the classifiers,
positive and fn is false-negative as shown in (2).
SVM, Random Forest, KNN and ANN. The evaluation of
results is shown using the confusion matrix, ROC Analysis, Recall = tp/(tp/fn) (2)
Scatter Plot and Distributions.
The weighted average of Precision and Recall is called
F-Measure as shown in (3).
F Score = 2*(Recall * Precision) / (Recall + Precision) (3)
Cohen's Kappa statistic is one among the list of Interrater
Reliability within raters. Po is the relative observed
agreement among raters, P e is the hypothetical probability of
chance agreement and K is the Kappa value[24].
K=(P o-Pe)/1-Pe (4)
Table 1: Kappa Value and Level of Agreement
Value of Kappa Level of Agreement
0.00-0.20 None
0.21-0.39 Weak
0.40-0.59 Minimal
0.60-0.79 Moderate
0.80-0.90 Strong
Above 0.90 Almost Perfect
Figure 5: Analytical Framework of the Proposed Method Table 1 shows the Kappa value and level of agreement. The
value of kappa from 0.00-0.20 is none, 0.21-0.39 is weak,
Receiver Operating Characteristics (ROC) is a plot used to
0.40-0.59 is minimal, 0.60-0.79 is moderate, 0.80-0.90 is
present trade off among classifiers [19]. Scatter plot is used to
strong and above 0.90 is almost perfect.
present data points within x and y axis to show how variables
affect each other [20]. In addition, the testing set utilized the
SVM as best fit classifier to perform the prediction of the 3. RESULTS AND DISCUSSION
classifier.
This section discusses the results of the study conducted. Two
classes were analyzed in four different classification models.
Table 2 shows the result of evaluation in the classification
models.
1103