
Page 18 - Development of a Language Translator from English to Waray
P. 18
Khenilyn P. Lewis et al., International Journal of Advanced Trends in Computer Science and Engineering, 9(2), March - April 2020, 1101 – 1106
On the other hand, the distribution of SVM for Potassium also seen in a data table composed of several different number of
presents higher number and relative density of Phosphorus. values. Those values were saved in a .csv file and was
processed using WEKA to determine the Kappa, CCI and ICI.
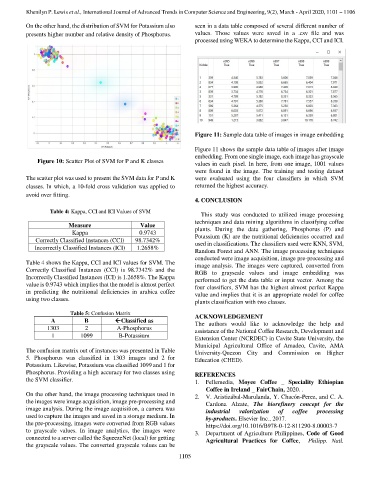
Figure 11: Sample data table of images in image embedding
Figure 11 shows the sample data table of images after image
embedding. From one single image, each image has grayscale
Figure 10: Scatter Plot of SVM for P and K classes
values in each pixel. In here, from one image, 1001 values
were found in the image. The training and testing dataset
The scatter plot was used to present the SVM data for P and K were evaluated using the four classifiers in which SVM
classes. In which, a 10-fold cross validation was applied to returned the highest accuracy.
avoid over fitting.
4. CONCLUSION
Table 4: Kappa, CCI and ICI Values of SVM
This study was conducted to utilized image processing
techniques and data mining algorithms in classifying coffee
Measure Value
plants. During the data gathering, Phosphorus (P) and
Kappa 0.9743
Potassium (K) are the nutritional deficiencies occurred and
Correctly Classified Instances (CCI) 98.7342%
used in classifications. The classifiers used were KNN, SVM,
Incorrectly Classified Instances (ICI) 1.2658%
Random Forest and ANN. The image processing techniques
conducted were image acquisition, image pre-processing and
Table 4 shows the Kappa, CCI and ICI values for SVM. The
image analysis. The images were captured, converted from
Correctly Classified Instances (CCI) is 98.7342% and the
RGB to grayscale values and image embedding was
Incorrectly Classified Instances (ICI) is 1.2658%. The Kappa
performed to get the data table or input vector. Among the
value is 0.9743 which implies that the model is almost perfect
four classifiers, SVM has the highest almost perfect Kappa
in predicting the nutritional deficiencies in arabica coffee
value and implies that it is an appropriate model for coffee
using two classes.
plants classification with two classes.
Table 5: Confusion Matrix
ACKNOWLEDGEMENT
A B Classified as
The authors would like to acknowledge the help and
1303 2 A-Phosphorus
assistance of the National Coffee Research, Development and
1 1099 B-Potassium
Extension Center (NCRDEC) in Cavite State University, the
Municipal Agricultural Office of Amadeo, Cavite, AMA
The confusion matrix out of instances was presented in Table University-Quezon City and Commission on Higher
5. Phosphorus was classified in 1303 images and 2 for Education (CHED).
Potassium. Likewise, Potassium was classified 1099 and 1 for
Phosphorus. Providing a high accuracy for two classes using
REFERENCES
the SVM classifier.
1. Fellemedia, Moyee Coffee _ Speciality Ethiopian
Coffee in Ireland _ FairChain, 2020. .
On the other hand, the image processing techniques used in
2. V. Aristizábal-Marulanda, Y. Chacón-Perez, and C. A.
the images were image acquisition, image pre-processing and
Cardona Alzate, The biorefinery concept for the
image analysis. During the image acquisition, a camera was
industrial valorization of coffee processing
used to capture the images and saved in a storage medium. In
by-products. Elsevier Inc., 2017.
the pre-processing, images were converted from RGB values
https://doi.org/10.1016/B978-0-12-811290-8.00003-7
to grayscale values. In image analytics, the images were
3. Department of Agriculture Philippines, Code of Good
connected to a server called the SqueezeNet (local) for getting
Agricultural Practices for Coffee, Philipp. Natl.
the grayscale values. The converted grayscale values can be
1105