
Page 22 - Development of a Language Translator from English to Waray
P. 22
Circulation in Computer Science, Vol.3, No.3, pp: (1-5), May 2018
www.ccsarchive.org
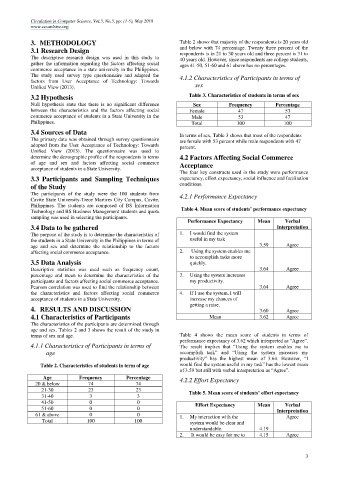
3. METHODOLOGY Table 2 shows that majority of the respondents is 20 years old
3.1 Research Design and below with 74 percentage. Twenty three percent of the
respondents is in 21 to 30 years old and three percent is 31 to
The descriptive research design was used in this study to 40 years old. However, since respondents are college students,
gather the information regarding the factors affecting social ages 41-50, 51-60 and 61 above has no percentages.
commerce acceptance in a state university in the Philippines.
The study used survey type questionnaire and adapted the 4.1.2 Characteristics of Participants in terms of
factors from User Acceptance of Technology: Towards
Unified View (2013). sex
3.2 Hypothesis Table 3. Characteristics of students in terms of sex
Null hypothesis state that there is no significant difference Sex Frequency Percentage
between the characteristics and the factors affecting social Female 47 53
commerce acceptance of students in a State University in the Male 53 47
Philippines. Total 100 100
3.4 Sources of Data In terms of sex, Table 3 shows that most of the respondents
The primary data was obtained through survey questionnaire are female with 53 percent while male respondents with 47
adopted from the User Acceptance of Technology: Towards percent.
Unified View (2013). The questionnaire was used to
determine the demographic profile of the respondents in terms 4.2 Factors Affecting Social Commerce
of age and sex and factors affecting social commerce Acceptance
acceptance of students in a State University.
The four key constructs used in the study were performance
3.3 Participants and Sampling Techniques expectancy, effort expectancy, social influence and facilitation
of the Study conditions.
The participants of the study were the 100 students from 4.2.1 Performance Expectancy
Cavite State University-Trece Martires City Campus, Cavite,
Philippines. The students are composed of BS Information
Technology and BS Business Management students and quota Table 4. Mean score of students’ performance expectancy
sampling was used in selecting the participants.
Performance Expectancy Mean Verbal
3.4 Data to be gathered Interpretation
The purpose of the study is to determine the characteristics of 1. I would find the system
the students in a State University in the Philippines in terms of useful in my task
age and sex and determine the relationship to the factors 3.59 Agree
affecting social commerce acceptance. 2. Using the system enables me
to accomplish tasks more
3.5 Data Analysis quickly.
Descriptive statistics was used such as frequency count, 3.64 Agree
percentage and mean to determine the characteristics of the 3. Using the system increases
participants and factors affecting social commerce acceptance. my productivity.
Pearson correlation was used to find the relationship between 3.64 Agree
the characteristics and factors affecting social commerce 4. If I use the system, I will
acceptance of students in a State University. increase my chances of
getting a raise.
4. RESULTS AND DISCUSSION 3.60 Agree
4.1 Characteristics of Participants Mean 3.62 Agree
The characteristics of the participants are determined through
age and sex. Tables 2 and 3 shows the result of the study in
terms of sex and age. Table 4 shows the mean score of students in terms of
performance expectancy of 3.62 which interpreted as “Agree”.
4.1.1 Characteristics of Participants in terms of The result implies that “Using the system enables me to
age accomplish task” and “Using the system increases my
productivity” has the highest mean of 3.64. However, “I
Table 2. Characteristics of students in term of age would find the system useful in my task” has the lowest mean
of 3.59 but still with verbal interpretation as “Agree”.
Age Frequency Percentage 4.2.2 Effort Expectancy
20 & below 74 74
21-30 23 23 Table 5. Mean score of students’ effort expectancy
31-40 3 3
41-50 0 0 Effort Expectancy Mean Verbal
51-60 0 0 Interpretation
61 & above 0 0 1. My interaction with the Agree
Total 100 100 system would be clear and
understandable. 4.19
2. It would be easy for me to 4.15 Agree
3