
Page 17 - Development of a Language Translator from English to Waray
P. 17
Khenilyn P. Lewis et al., International Journal of Advanced Trends in Computer Science and Engineering, 9(2), March - April 2020, 1101 – 1106
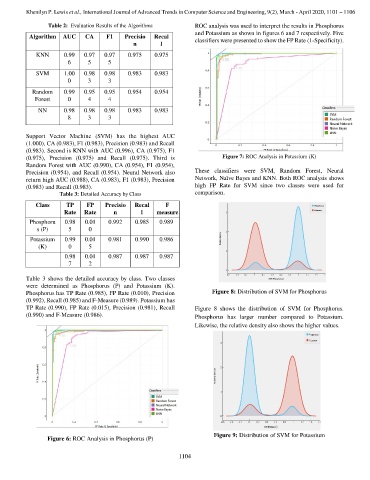
Table 2: Evaluation Results of the Algorithms ROC analysis was used to interpret the results in Phosphorus
and Potassium as shown in figures 6 and 7 respectively. Five
Algorithm AUC CA F1 Precisio Recal
classifiers were presented to show the FP Rate (1-Specificity).
n l
KNN 0.99 0.97 0.97 0.975 0.975
6 5 5
SVM 1.00 0.98 0.98 0.983 0.983
0 3 3
Random 0.99 0.95 0.95 0.954 0.954
Forest 0 4 4
NN 0.98 0.98 0.98 0.983 0.983
8 3 3
Support Vector Machine (SVM) has the highest AUC
(1.000), CA (0.983), F1 (0.983), Precision (0.983) and Recall
(0.983). Second is KNN with AUC (0.996), CA (0.975), F1
(0.975), Precision (0.975) and Recall (0.975). Third is Figure 7: ROC Analysis in Potassium (K)
Random Forest with AUC (0.990), CA (0.954), F1 (0.954),
Precision (0.954), and Recall (0.954). Neural Network also These classifiers were SVM, Random Forest, Neural
return high AUC (0.988), CA (0.983), F1 (0.983), Precision Network, Naïve Bayes and KNN. Both ROC analysis shows
(0.983) and Recall (0.983). high FP Rate for SVM since two classes were used for
Table 3: Detailed Accuracy by Class comparison.
Class TP FP Precisio Recal F
Rate Rate n l measure
Phosphoru 0.98 0.01 0.992 0.985 0.989
s (P) 5 0
Potassium 0.99 0.01 0.981 0.990 0.986
(K) 0 5
0.98 0.01 0.987 0.987 0.987
7 2
Table 3 shows the detailed accuracy by class. Two classes
were determined as Phosphorus (P) and Potassium (K).
Phosphorus has TP Rate (0.985), FP Rate (0.010), Precision Figure 8: Distribution of SVM for Phosphorus
(0.992), Recall (0.985) and F-Measure (0.989). Potassium has
TP Rate (0.990), FP Rate (0.015), Precision (0.981), Recall Figure 8 shows the distribution of SVM for Phosphorus.
(0.990) and F-Measure (0.986). Phosphorus has larger number compared to Potassium.
Likewise, the relative density also shows the higher values.
Figure 9: Distribution of SVM for Potassium
Figure 6: ROC Analysis in Phosphorus (P)
1104