
Page 10 - danville
P. 10
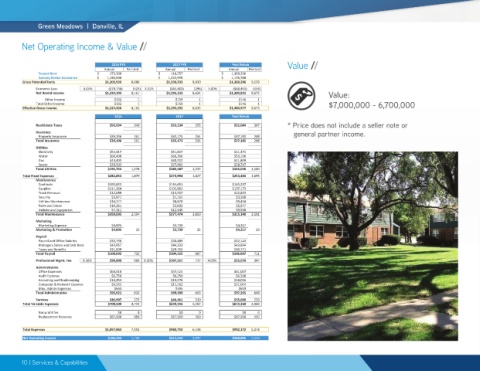
Green Meadows  |  Danville, IL


        Net Operating Income & Value //
        OPERATING HISTORY AND PROFORMA

                                      2016 FYE            2017 FYE            Post Rehab        Value //
                                   Annual  Per Unit     Annual  Per Unit    Annual  Per Unit
                Tenant Rent      $              172,330   $              116,557   $           1,369,296
                Subsidy Rental Assistance  $           1,130,600   $           1,222,976   $           1,176,788
        Gross Potential Rents       $1,302,930  8,686   $1,339,533  8,930    $1,369,296  9,129
             Economic Loss   6.04%   ($78,736)  (525)  3.31%  ($44,400)  (296)  5.00%  ($68,465)  (456)
             Net Rental Income      $1,224,194  8,161   $1,295,133  8,634    $1,300,831  8,672               Value:
                Other Income           $132   1            $159    1            $146  1
             Total Other Income        $132   1            $159    1            $146  1                      $7,000,000 - 6,700,000
        Effective Gross Income      $1,224,326  8,162   $1,295,292  8,635    $1,300,977  8,673
                                       2016                2017               Post Rehab
             Real Estate Taxes       $50,934  340        $53,234  355         $52,084  347      * Price does not include a seller note or
             Insurance                                                                             general partner income.
                Property Insurance   $39,196  261        $35,173  234         $37,185  248
             Total Insurance         $39,196  261        $35,173  234         $37,185  248
             Utilities
                Electricity          $52,417             $51,017              $41,374
                Water                $66,400             $66,366              $53,106
                Gas                  $43,405             $40,212              $41,809
                Sewer                $29,502             $27,992              $28,747
             Total Utilities         $191,724  1,278     $185,587  1,237      $165,036  1,100
        Total Fixed Expenses         $281,854  1,879     $273,994  1,827      $254,304  1,695
             Maintenance
                Contracts            $195,822            $134,651             $165,237
                Supplies             $111,364            $102,981             $107,173
                Trash Removal        $12,089             $13,557              $12,823
                Security              $5,971              $1,165               $3,568
                Utilities Maintenance  $16,277            $8,879               $9,434
                Paint and Décor      $10,261              $3,692               $6,977
                Vehicle and Equipment  $7,311            $12,549               $9,930
             Total Maintenance       $359,095  2,394     $277,474  1,850      $315,140  2,101
             Marketing
                Marketing Expense     $4,895              $3,739               $4,317
             Marketing & Promotion    $4,895  33          $3,739  25           $4,317  29
             Payroll
                Payroll and Office Salaries  $33,796     $30,489              $32,143
                Managers Salary and Unit Rent  $43,057   $44,331              $43,694
                Taxes and Benefits   $31,839             $29,702              $30,771
             Total Payroll           $108,692  725       $104,522  697        $106,607  711
             Professional Mgmt. Fee  8.16%  $99,899  666  8.30%  $107,551  717  4.00%  $52,039  347
             Administrative
                Office Expenses      $64,610             $57,524              $61,067
                Audit Expense         $6,750              $6,250               $6,500
                Accouting and Bookkeeping  $16,453       $19,578              $18,016
                Computer & Network Expense  $6,565       $15,562              $11,064
                Misc. Admin Expenses   $643                $595                 $619
             Total Administrative    $95,021  633        $99,509  663         $97,265  648
             Services                $40,907  273        $46,461  310         $35,000  233
        Total Variable Expenses      $708,509  4,723     $639,256  4,262      $610,368  4,069
                Nonprofit fee           $0    0             $0     0             $0   0
                Replacement Reserves  $67,500  450       $67,500  450         $67,500  450
        Total Expenses              $1,057,863  7,052    $980,750  6,538      $932,172  6,214
        Net Operating Income         $166,463           1,110  $314,542           2,097  $368,805      2,459


        10 | Services & Capabilities