
Page 32 - OF0620 Online_Neat
P. 32
Soya bean crop quality survey results:
2018/19 production season
By Jolanda Nortjé, manager: laboratory, Southern African Grain Laboratory NPC
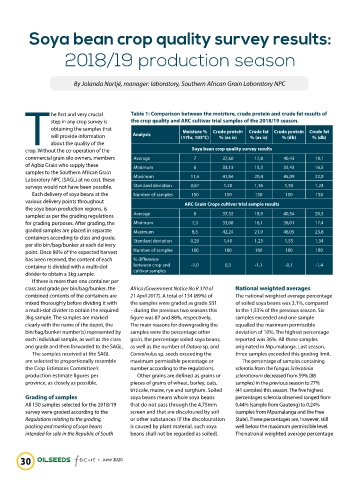
he first and very crucial Table 1: Comparison between the moisture, crude protein and crude fat results of
step in any crop survey is the crop quality and ARC cultivar trial samples of the 2018/19 season.
obtaining the samples that Moisture % Crude protein Crude fat Crude protein Crude fat
will provide information Analysis (17hr, 103°C) % (as is) % (as is) % (db) % (db)
T about the quality of the
crop. Without the co-operation of the Soya bean crop quality survey results
commercial grain silo owners, members Average 7 37,60 17,8 40,43 19,1
of Agbiz Grain who supply these Minimum 6 33,13 15,3 35,43 16,5
samples to the Southern African Grain
Laboratory NPC (SAGL) at no cost, these Maximum 11,4 41,84 20,4 45,09 22,0
surveys would not have been possible. Standard deviation 0,67 1,20 1,16 1,30 1,24
Each delivery of soya beans at the Number of samples 150 150 150 150 150
various delivery points throughout ARC Grain Crops cultivar trial sample results
the soya bean production regions, is
sampled as per the grading regulations Average 8 37,32 18,9 40,54 20,5
for grading purposes. After grading, the Minimum 7,3 33,08 16,1 36,01 17,4
graded samples are placed in separate Maximum 8,5 42,24 21,9 46,05 23,8
containers according to class and grade, Standard deviation 0,29 1,40 1,23 1,55 1,34
per silo bin/bag/bunker at each delivery
point. Once 80% of the expected harvest Number of samples 180 180 180 180 180
has been received, the content of each % difference
container is divided with a multi-slot between crop and -1,0 0,3 -1,1 -0,1 -1,4
divider to obtain a 3kg sample. cultivar samples
If there is more than one container per
class and grade per bin/bag/bunker, the Africa (Government Notice No R 370 of National weighted averages
combined contents of the containers are 21 April 2017). A total of 134 (89%) of The national weighted average percentage
mixed thoroughly before dividing it with the samples were graded as grade SB1 of soiled soya beans was 3,1%, compared
a multi-slot divider to obtain the required – during the previous two seasons this to the 1,53% of the previous season. Six
3kg sample. The samples are marked figure was 87 and 88%, respectively. samples exceeded and one sample
clearly with the name of the depot, the The main reasons for downgrading the equalled the maximum permissible
bin/bag/bunker number(s) represented by samples were the percentage other deviation of 10%. The highest percentage
each individual sample, as well as the class grain, the percentage soiled soya beans, reported was 36%. All these samples
and grade and then forwarded to the SAGL. as well as the number of Datura sp. and originated in Mpumalanga. Last season,
The samples received at the SAGL Convolvulus sp. seeds exceeding the three samples exceeded this grading limit.
are selected to proportionally resemble maximum permissible percentage or The percentage of samples containing
the Crop Estimates Committee’s number according to the regulations. sclerotia from the fungus Sclerotinia
production estimate figures per Other grains are defined as grains or sclerotiorum decreased from 59% (88
province, as closely as possible. pieces of grains of wheat, barley, oats, samples) in the previous season to 27%
triticale, maize, rye and sorghum. Soiled (41 samples) this season. The five highest
Grading of samples soya beans means whole soya beans percentages sclerotia observed ranged from
All 150 samples selected for the 2018/19 that do not pass through the 4,75mm 0,44% (sample from Gauteng) to 0,24%
survey were graded according to the screen and that are discoloured by soil (samples from Mpumalanga and the Free
Regulations relating to the grading, or other substances (if the discolouration State). These percentages are, however, still
packing and marking of soya beans is caused by plant material, such soya well below the maximum permissible level.
intended for sale in the Republic of South beans shall not be regarded as soiled). The national weighted average percentage
30 June 2020