
Page 35 - OF0620 Online_Neat
P. 35
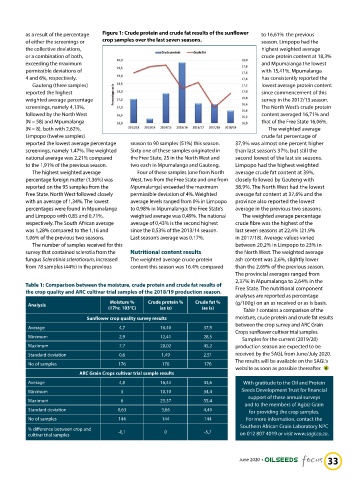
as a result of the percentage   Figure 1: Crude protein and crude fat results of the sunflower   to 16,61%  the previous
          of either the screenings or   crop samples over the last seven seasons.       season. Limpopo had the
          the collective deviations,                                                    highest weighted average
          or a combination of both,                                                     crude protein content at 18,3%
          exceeding the maximum                                                         and Mpumalanga the lowest
          permissible deviations of                                                     with 15,41%. Mpumalanga
          4 and 6%, respectively.                                                       has consistently reported the
            Gauteng (three samples)                                                     lowest average protein content
          reported the highest                                                          since commencement of this
          weighted average percentage                                                   survey in the 2012/13 season.
          screenings, namely 4,13%,                                                     The North West’s crude protein
          followed by the North West                                                    content averaged 16,71% and
          (N = 58) and Mpumalanga                                                       that of the Free State 16,06%.
          (N = 8), both with 2,62%.                                                       The weighted average
          Limpopo (twelve samples)                                                      crude fat percentage of
          reported the lowest average percentage   season to 90 samples (51%) this season.   37,9% was almost one percent higher
          screenings, namely 1,47%. The weighted   Sixty one of these samples originated in   than last season’s 37%, but still the
          national average was 2,21% compared   the Free State, 25 in the North West and   second lowest of the last six seasons.
          to the 1,91% of the previous season.  two each in Mpumalanga and Gauteng.   Limpopo had the highest weighted
            The highest weighted average       Four of these samples (one from North   average crude fat content at 39%,
          percentage foreign matter (1,36%) was   West, two from the Free State and one from   closely followed by Gauteng with
          reported on the 95 samples from the   Mpumalanga) exceeded the maximum   38,9%. The North West had the lowest
          Free State. North West followed closely   permissible deviation of 4%. Weighted   average fat content at 37,6% and the
          with an average of 1,34%. The lowest   average levels ranged from 0% in Limpopo   province also reported the lowest
          percentages were found in Mpumalanga   to 0,98% in Mpumalanga; the Free State’s   average in the previous two seasons.
          and Limpopo with 0,85 and 0,71%,   weighted average was 0,49%. The national   The weighted average percentage
          respectively. The South African average   average of 0,43% is the second highest   crude fibre was the highest of the
          was 1,28% compared to the 1,16 and   since the 0,53% of the 2013/14 season.   last seven seasons at 22,4% (21,9%
          1,06% of the previous two seasons.   Last season’s average was 0,17%.   in 2017/18). Average values varied
            The number of samples received for this                            between 20,2% in Limpopo to 23% in
          survey that contained sclerotia from the   Nutritional content results  the North West. The weighted average
          fungus Sclerotinia sclerotiorum, increased   The weighted average crude protein   ash content was 2,6%, slightly lower
          from 78 samples (44%) in the previous   content this season was 16.4% compared   than the 2,69% of the previous season.
                                                                               The provincial averages ranged from
                                                                               2,37% in Mpumalanga to 2,64% in the
          Table 1: Comparison between the moisture, crude protein and crude fat results of   Free State. The nutritional component
          the crop quality and ARC cultivar trial samples of the 2018/19 production season.
                                                                               analyses are reported as percentage
                                     Moisture %    Crude protein %   Crude fat %   (g/100g) on an as received or as is basis.
          Analysis
                                     (17hr, 103°C)    (as is)       (as is)       Table 1 contains a comparison of the
                              Sunflower crop quality survey results            moisture, crude protein and crude fat results
                                                                               between the crop survey and ARC Grain
          Average                        4,7          16,40          37,9
                                                                               Crops sunflower cultivar trial samples.
          Minimum                        2,9          12,41          28,5
                                                                                 Samples for the current (2019/20)
          Maximum                        7,7          20,02          45,2      production season are expected to be
          Standard deviation             0,6           1,49          2,51      received by the SAGL from June/July 2020.
                                                                               The results will be available on the SAGL’s
          No of samples                 176            176           176
                                                                               website as soon as possible thereafter.
                           ARC Grain Crops cultivar trial sample results
          Average                        4,8          16,44          43,6         With gratitude to the Oil and Protein
          Minimum                        3            10,10          34,4        Seeds Development Trust for financial
                                                                                   support of these annual surveys
          Maximum                        6            25,37          55,4
                                                                                  and to the members of Agbiz Grain
          Standard deviation            0,63           3,65          4,49           for providing the crop samples.
          No of samples                 144            144           144           For more information, contact the
                                                                                 Southern African Grain Laboratory NPC
          % difference between crop and   -0,1          0            -5,7
          cultivar trial samples                                                 on 012 807 4019 or visit www.sagl.co.za.


                                                                                June 2020                     33