
Page 49 - OF0620 Online_Neat
P. 49
General
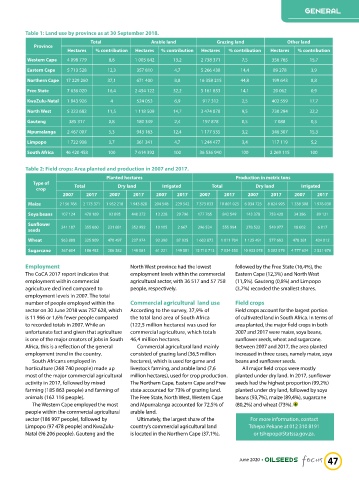
Table 1: Land use by province as at 30 September 2018.
Total Arable land Grazing land Other land
Province
Hectares % contribution Hectares % contribution Hectares % contribution Hectares % contribution
Western Cape 4 098 779 8,8 1 003 642 13,2 2 738 371 7,5 356 765 15,7
Eastern Cape 5 713 528 12,3 357 810 4,7 5 266 438 14,4 89 278 3,9
Northern Cape 17 229 260 37,1 671 400 8,8 16 358 215 44,8 199 643 8,8
Free State 7 636 020 16,4 2 454 122 32,2 5 161 833 14,1 20 062 0,9
KwaZulu-Natal 1 843 926 4 524 053 6,9 917 312 2,5 402 559 17,7
North West 5 323 682 11,5 1 118 509 14,7 3 474 878 9,5 730 294 32,2
Gauteng 385 317 0,8 180 349 2,4 197 878 0,5 7 088 0,3
Mpumalanga 2 467 007 5,3 943 163 12,4 1 177 535 3,2 346 307 15,3
Limpopo 1 722 938 3,7 361 341 4,7 1 244 477 3,4 117 119 5,2
South Africa 46 420 458 100 7 614 392 100 36 536 940 100 2 269 115 100
Table 2: Field crops: Area planted and production in 2007 and 2017.
Planted hectares Production in metric tons
Type of Total Dry land Irrigated Total Dry land Irrigated
crop
2007 2017 2007 2017 2007 2017 2007 2017 2007 2017 2007 2017
Maize 2 156 766 2 173 371 1 952 218 1 943 828 204 548 229 542 7 373 033 10 801 025 6 034 723 8 824 995 1 338 308 1 976 030
Soya beans 107 124 470 169 93 895 440 372 13 228 29 796 177 765 842 549 143 378 753 428 34 386 89 121
Sunflower
seeds 241 187 355 660 231 081 352 992 10 105 2 667 296 524 555 994 278 522 549 977 18 002 6 017
Wheat 563 888 325 909 470 497 237 974 93 390 87 935 1 603 872 1 011 704 1 125 491 577 692 478 381 434 012
Sugarcane 267 604 186 483 206 382 149 581 61 221 149 581 15 710 713 7 534 550 10 933 078 5 002 579 4 777 634 2 531 970
Employment North West province had the lowest followed by the Free State (16,4%), the
The CoCA 2017 report indicates that employment levels within the commercial Eastern Cape (12,3%) and North West
employment within commercial agricultural sector, with 36 517 and 57 758 (11,5%). Gauteng (0,8%) and Limpopo
agriculture declined compared to people, respectively. (3,7%) recorded the smallest shares.
employment levels in 2007. The total
number of people employed within the Commercial agricultural land use Field crops
sector on 30 June 2018 was 757 628, which According to the survey, 37,9% of Field crops account for the largest portion
is 11 966 or 1,6% fewer people compared the total land area of South Africa of cultivated land in South Africa. In terms of
to recorded totals in 2007. While an (122,5 million hectares) was used for area planted, the major field crops in both
unfortunate fact and given that agriculture commercial agriculture, which totals 2007 and 2017 were maize, soya beans,
is one of the major creators of jobs in South 46,4 million hectares. sunflower seeds, wheat and sugarcane.
Africa, this is a reflection of the general Commercial agricultural land mainly Between 2007 and 2017, the area planted
employment trend in the country. consisted of grazing land (36,5 million increased in three cases, namely maize, soya
South Africans employed in hectares), which is used for game and beans and sunflower seeds.
horticulture (268 740 people) made up livestock farming, and arable land (7,6 All major field crops were mostly
most of the major commercial agricultural million hectares), used for crop production. planted under dry land. In 2017, sunflower
activity in 2017, followed by mixed The Northern Cape, Eastern Cape and Free seeds had the highest proportion (99,2%)
farming (185 863 people) and farming of state accounted for 73% of grazing land. planted under dry land, followed by soya
animals (162 116 people). The Free State, North West, Western Cape beans (93,7%), maize (89,4%), sugarcane
The Western Cape employed the most and Mpumalanga accounted for 72,5% of (80,2%) and wheat (73%).
people within the commercial agricultural arable land.
sector (186 997 people), followed by Ultimately, the largest share of the For more information, contact
Limpopo (97 478 people) and KwaZulu- country’s commercial agricultural land Tshepo Pekane at 012 310 8191
Natal (96 206 people). Gauteng and the is located in the Northern Cape (37,1%), or tshepop@Statssa.gov.za.
f
June 2020 Oilseeds ocus 47