
Page 8 - Water Every Drop Counts
P. 8
2
Water on Earth
So Much, So Little
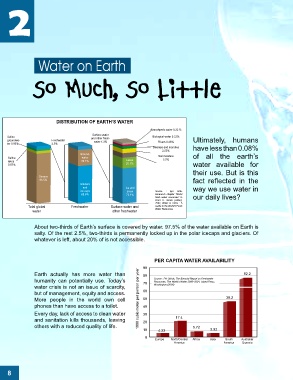
DISTRIBUTION OF EARTH’S WATER
Atmoshperic water 0.22 %
Surface water
Saline and other fresh- Biological water 0.22%
groundwa- Freshwater water 1.3% Rivers 0.46% Ultimately, humans
ter 0.93% 2.5%
Swamps and marshes have less than 0.08%
2.53%
Ground-
Saline water Soil moisture of all the earth’s
3.5%
lakes 30.1% Lakes
0.07% 20.1% water available for
their use. But is this
Oceans
96.5% fact reflected in the
Glaciers
and Ice and way we use water in
ice caps snow Source : Igor Shik-
68.6% 73.1% lomanov’s chapter “World
fresh water resources” in our daily lives?
Peter H. Gleick (editor),
1993, Water in Crisis : A
Total global Freshwater Surface water and Guide to the World’s Fresh
Water Resources.
water other freshwater
About two-thirds of Earth’s surface is covered by water. 97.5% of the water available on Earth is
salty. Of the rest 2.5%, two-thirds is permanently locked up in the polar icecaps and glaciers. Of
whatever is left, about 20% of is not accessible.
PER CAPITA WATER AVAILABILITY
90
Earth actually has more water than 80 82.2
humanity can potentially use. Today’s 70 Source : PH Gleick, The Biennial Report on Freshwater
Resources, The World’s Water 2000–2001, Island Press,
water crisis is not an issue of scarcity, Washington (2000)
but of management, equity and access. 60
More people in the world own cell 1000 cubic meter per person per year 50 38.2
phones than have access to a toilet. 40
Every day, lack of access to clean water 30
and sanitation kills thousands, leaving 20 17.4
others with a reduced quality of life. 10 4.23 5.72 3.92
0 Europe North/Central Africa Asia South Australia/
America America Oceania
8