
Page 35 - Technology Roadmap Transportation
P. 35
TECHNOLOGY ROADMAP: TRANSPORTATION
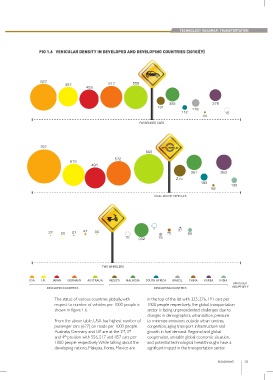
FIG 1.6 VEHICULAR DENSITY IN DEVELOPED AND DEVELOPING COUNTRIES (2010)[9]
627
457 517 556
453
325 276
191 178
112 15
15
44
PASSENGER CARS
797 TOTAL VEHICLES
695
572
519
491
361 363
275
165
132
58
TOTAL MOTOR VEHICLES
7 7 37
27 20 27 47 30 75 96
20
10
10 75
332
TWO WHEELERS
USA UK JAPAN GERMANY AUSTRALIA MEXICO MALAYSIA SOUTH AFRICA BRAZIL CHINA KOREA INDIA
UNITS PER
DEVELOPED COUNTRIES DEVELOPING COUNTRIES 1000 PEOPLE
The status of various countries globally, with in the top of the list with 325, 276, 191 cars per
respect to number of vehicles per 1000 people is 1000 people respectively. The global transportation
shown in figure 1.6. sector is facing unprecedented challenges due to
changes in demographics, urbanization, pressure
From the above table, USA has highest number of to minimize emissions outside urban centres,
passenger cars (627) on roads per 1000 people. congestion, aging transport infrastructure and
Australia, Germany and UK are at the 2 , 3 growth in fuel demand. Regional and global
rd
nd
th
and 4 position with 556, 517 and 457 cars per cooperation, unstable global economic situation,
1000 people respectively. While talking about the and potential technological breakthroughs have a
developing nations, Malaysia, Korea, Mexico are significant impact in the transportation sector.
ROADWAYS 33