Page 42 - 2016 Budget, Bond and Innovation Recommendations
P. 42

HIGH GROWTH AREA

                          EAST OF E-470


                          Elementary Schools


                          Projected Enrollment 2016-20


                          Black Forest Hills, Buffalo Trail,

                          Coyote Hills, Pine Ridge

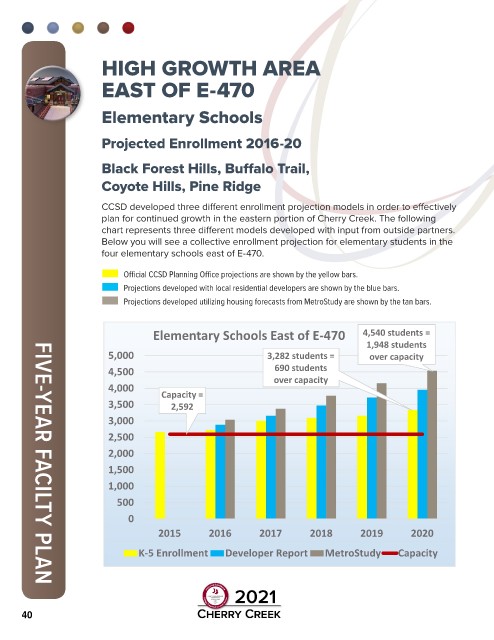
                          CCSD developed three different enrollment projection models in order to effectively
                          plan for continued growth in the eastern portion of Cherry Creek. The following
                          chart represents three different models developed with input from outside partners.
                          Below you will see a collective enrollment projection for elementary students in the
                          four elementary schools east of E-470.


                          ■  Official CCSD Planning Office projections are shown by the yellow bars.
                                Current Elementary Schools East of E-470
                          ■  Projections developed with local residential developers are shown by the blue bars.
                          ■  Projections developed utilizing housing forecasts from MetroStudy are shown by the tan bars.


                                       Elementary Schools East of E-470                    4,540 students =
                                                                                            1,948 students
                            5,000                                  3,282 students =          over capacity
                                                                     690 students
                            4,500                                    over capacity
                            4,000        Capacity =
                            3,500          2,592

                            3,000
                            2,500

                            2,000
                            1,500

                            1,000
                              500

                                 0
                                        2015         2016        2017         2018        2019         2020

                                   K-5 Enrollment        Developer Report         MetroStudy        Capacity


          FIVE-YEAR FACILTY PLAN


      40
   37   38   39   40   41   42   43   44   45   46   47