
Page 297 - Crisis in Higher Education
P. 297
Reshaping Faculty’s Role • 267
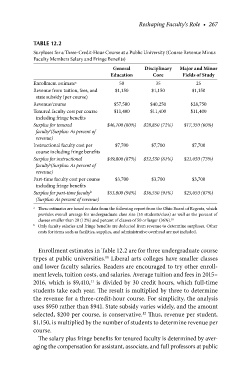
TABLE 12.2
Surpluses for a Three-Credit-Hour Course at a Public University (Course Revenue Minus
Faculty Members Salary and Fringe Benefits)
General Disciplinary Major and Minor
Education Core Fields of Study
Enrollment estimate a 50 35 25
Revenue from tuition, fees, and $1,150 $1,150 $1,150
state subsidy (per course)
Revenue/course $57,500 $40,250 $28,750
Tenured faculty cost per course $11,400 $11,400 $11,400
including fringe benefits
Surplus for tenured $46,100 (80%) $28,850 (72%) $17,350 (60%)
faculty (Surplus: As percent of
†
revenue)
Instructional faculty cost per $7,700 $7,700 $7,700
course including fringe benefits
Surplus for instructional $49,800 (87%) $32,550 (81%) $21,050 (73%)
faculty (Surplus: As percent of
b
revenue)
Part-time faculty cost per course $3,700 $3,700 $3,700
including fringe benefits
Surplus for part-time faculty $53,800 (94%) $36,550 (91%) $25,050 (87%)
b
(Surplus: As percent of revenue)
a These estimates are based on data from the following report from the Ohio Board of Regents, which
provides overall average for undergraduate class size (33 students/class) as well as the percent of
classes smaller than 20 (12%) and percent of classes of 50 or larger (36%). 10
b Only faculty salaries and fringe benefits are deducted from revenue to determine surpluses. Other
costs for items such as facilities, supplies, and administrative overhead are not included.
Enrollment estimates in Table 12.2 are for three undergraduate course
types at public universities. Liberal arts colleges have smaller classes
10
and lower faculty salaries. Readers are encouraged to try other enroll-
ment levels, tuition costs, and salaries. Average tuition and fees in 2015–
2016, which is $9,410, is divided by 30 credit hours, which full-time
11
students take each year. The result is multiplied by three to determine
the revenue for a three-credit-hour course. For simplicity, the analysis
uses $950 rather than $941. State subsidy varies widely, and the amount
selected, $200 per course, is conservative. Thus, revenue per student,
12
$1,150, is multiplied by the number of students to determine revenue per
course.
The salary plus fringe benefits for tenured faculty is determined by aver-
aging the compensation for assistant, associate, and full professors at public