
Page 385 - VIRANSH COACHING CLASSES
P. 385
8. Statement showing changes in cash and cash equivalent during a particular period.
9. Activity related to acquisition of long term assets and investment.
10. The ratio that establishes relationship between Quick Assets and Current Liabilities
C. State true or false with reasons.
1. Financial Statement includes only Balance Sheet.
2. Analysis of financial statement is a tool but not a remedy.
3. Purchase of Fixed Assets is operating cash flow.
4. Dividend paid is not a source of fund.
5. Gross Profit depends upon Net Sales. ,
6. Payment of cash against purchase of stock is use of fund.
7. Ratio Analysis is useful for inter firm comparison.
8. The short term deposits are considered as cash equivalent.
9. Activity Ratios Turnover Ratios are the same.
10. Current Ratio measures the liquidity of the business.
11. Ratio analysis measures profitability efficiency and financial soundness of the business.
12. Usually current ratio should be 3:1.
D. Answer in one sentence only.
1. Mention two objectives of comparative statement.
2. State three examples of cash in flows.
3. State three examples of cash out flows.
4. Give the formula of Gross Profit Ratio.
5. Give the formula of gross profit
6. State any three examples of current assets.
7. Give the formula of current ratio.
8. Give the formula of quick assets.
9. State the formula of cost of goods sold.
10. State the formula of Average Stock.
Practical Problems
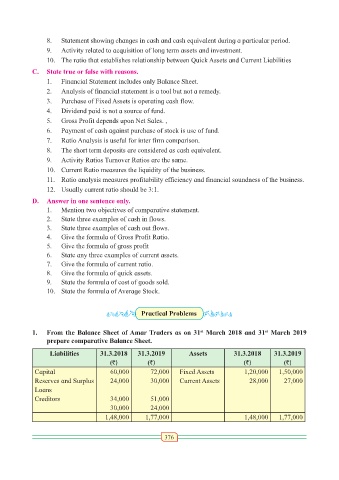
1. From the Balance Sheet of Amar Traders as on 31 March 2018 and 31 March 2019
st
st
prepare comparative Balance Sheet.
Liabilities 31.3.2018 31.3.2019 Assets 31.3.2018 31.3.2019
(`) (`) (`) (`)
Capital 60,000 72,000 Fixed Assets 1,20,000 1,50,000
Reserves and Surplus 24,000 30,000 Current Assets 28,000 27,000
Loans
Creditors 34,000 51,000
30,000 24,000
1,48,000 1,77,000 1,48,000 1,77,000
376