
Page 24 - TOP 5 UX UI DESIGN COMPANIES
P. 24
WHY
IS IMPORTANT WHEN DESIGNING
EXPERIENCES
One of the main factors of good a combination of imagery
user experience is ease of use. and type. According to the
Data visualization applies this to Interaction Design Foundation, places the information in front of
sets of data to make reading and data visualizations are defined as, them, rather than in their head.
interpreting information easy. “the graphical display of abstract If information becomes hard to find
It breaks down complex bits of information for two purposes: or read, it leads to frustration on
information and formats them sense-making (also called data the part of the user, which leads to
into a visual representation that is analysis) and communication.” a negative interaction. By making
cleaner and easier to understand. Breaking up the information the user work less to analyze the
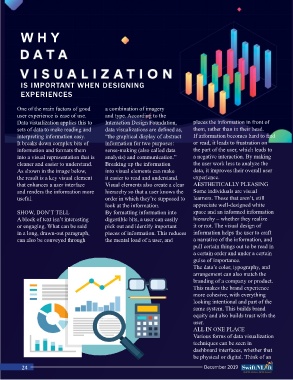
As shown in the image below, into visual elements can make data, it improves their overall user
the result is a key visual element it easier to read and understand. experience.
that enhances a user interface Visual elements also create a clear AESTHETICALLY PLEASING
and renders the information more hierarchy so that a user knows the Some individuals are visual
useful. order in which they’re supposed to learners. Those that aren’t, still
look at the information. appreciate well-designed white
SHOW, DON’T TELL By formatting information into space and an informed information
A block of text isn’t interesting digestible bits, a user can easily hierarchy – whether they realize
or engaging. What can be said pick out and identify important it or not. The visual design of
in a long, drawn-out paragraph, pieces of information. This reduces information helps the user to craft
can also be conveyed through the mental load of a user, and a narrative of the information, and
pull certain things out to be read in
a certain order and under a certain
guise of importance.
The data’s color, typography, and
arrangement can also match the
branding of a company or product.
This makes the brand experience
more cohesive, with everything
looking intentional and part of the
same system. This builds brand
equity and also builds trust with the
user.
ALL IN ONE PLACE
Various forms of data visualization
techniques can be seen in
dashboard interfaces, whether that
be physical or digital. Think of an
24 December 2019