
Page 178 - Cambridge+Checkpoint+Mathematics+Coursebook+9
P. 178
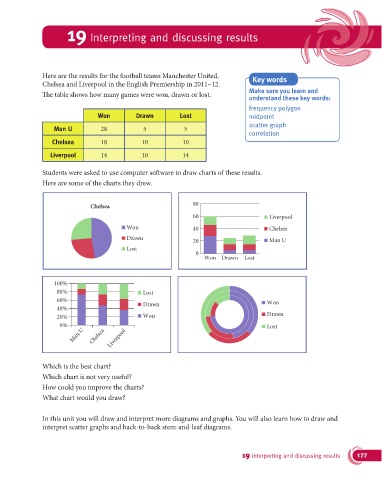
19 Interpreting and discussing results


               Here are the results for the football teams Manchester United,        Key words
               Chelsea and Liverpool in the English Premiership in 2011–12.


               !e table shows how many games were won, drawn or lost.               Make sure you learn and
                                                                                    understand these key words:
                                                                                    frequency polygon
                                  Won         Drawn          Lost                   midpoint
                                                                                    scatter graph
                   Man U           28            5             5
                                                                                    correlation
                  Chelsea          18           10            10

                  Liverpool        14           10            14

               Students were asked to use computer so"ware to draw charts of these results.

               Here are some of the charts they drew.


                               Chelsea                           80
                                                                 60                        Liverpool

                                           Won                   40                        Chelsea
                                           Drawn
                                                                 20                        Man U
                                           Lost
                                                                  0
                                                                     Won Drawn     Lost


                   100%
                    80%                          Lost
                    60%
                                                 Drawn                                    Won
                    40%
                    20%                          Won                                      Drawn
                     0%                                                                   Lost
                         Man U  Chelsea  Liverpool


               Which is the best chart?
               Which chart is not very useful?

               How could you improve the charts?
               What chart would you draw?


               In this unit you will draw and interpret more diagrams and graphs. You will also learn how to draw and
               interpret scatter graphs and back-to-back stem-and-leaf diagrams.


                                                                                  19 Interpreting and discussing results  177