
Page 183 - Cambridge+Checkpoint+Mathematics+Coursebook+9
P. 183
19.3 Interpreting and drawing scatter graphs
19.3 Interpreting and drawing scatter graphs
A scatter graph is a useful way to compare two sets of data.
You can use a scatter graph to $nd out whether there is a correlation,
or relationship, between the two sets of data.
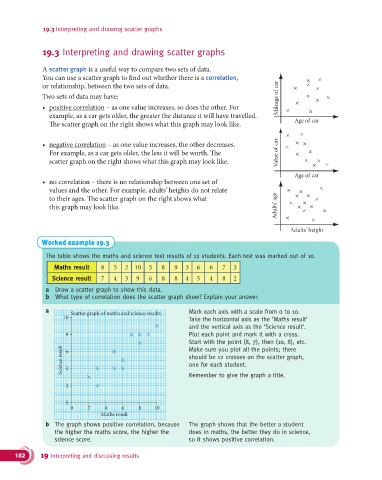
Two sets of data may have: Mileage of car
t positive correlation – as one value increases, so does the other. For
example, as a car gets older, the greater the distance it will have travelled.
!e scatter graph on the right shows what this graph may look like. Age of car
t negative correlation – as one value increases, the other decreases.
For example, as a car gets older, the less it will be worth. !e Value of car
scatter graph on the right shows what this graph may look like.
Age of car
t no correlation – there is no relationship between one set of
values and the other. For example, adults’ heights do not relate
to their ages. !e scatter graph on the right shows what
this graph may look like. Adults’ age
Adults’ height
Worked example 19.3
The table shows the maths and science test results of 12 students. Each test was marked out of 10.
Maths result 8 5 2 10 5 8 9 3 6 6 7 3
Science result 7 4 3 9 6 8 8 4 5 4 8 2
a Draw a scatter graph to show this data.
b What type of correlation does the scatter graph show? Explain your answer.
a Scatter graph of maths and science results Mark each axis with a scale from 0 to 10.
10 Take the horizontal axis as the ‘Maths result’
and the vertical axis as the ‘Science result’.
8 Plot each point and mark it with a cross.
Start with the point (8, 7), then (10, 8), etc.
Science result 6 4 should be 12 crosses on the scatter graph,
Make sure you plot all the points; there
one for each student.
2 Remember to give the graph a title.
0
0 2 4 6 8 10
Maths result
b The graph shows positive correlation, because The graph shows that the better a student
the higher the maths score, the higher the does in maths, the better they do in science,
science score. so it shows positive correlation.
182 19 Interpreting and discussing results