
Page 185 - Cambridge+Checkpoint+Mathematics+Coursebook+9
P. 185
19.4 Interpreting and drawing stem-and-leaf diagrams
19.4 Interpreting and drawing stem-and-leaf diagrams
You already know how to use ordered stem-and-leaf diagrams to display a set of data.
You can use a back-to-back stem-and-leaf diagram to display two sets of data.
In a back-to-back stem-and-leaf diagram, you write one set of data with its ‘leaves’ to the right of the
stem. !en you write the second set of data with its ‘leaves’ to the le" of the stem. Both sets of numbers
count from the stem, so the second set is written ‘backwards’.
Remember, when you draw an ordered stem-and-leaf diagram, you should:
t write the numbers in order of size, smallest nearest the stem
t write a key to explain what the numbers mean
t keep all the numbers in line, vertically and horizontally.
Worked example 19.4
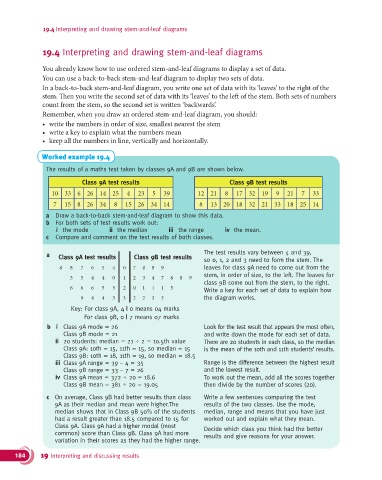
The results of a maths test taken by classes 9A and 9B are shown below.
Class 9A test results Class 9B test results
10 33 6 26 14 25 4 23 5 39 12 21 8 17 32 19 9 21 7 33
7 15 8 26 34 8 15 26 34 14 8 13 20 18 32 21 33 18 25 14
a Draw a back-to-back stem-and-leaf diagram to show this data.
b For both sets of test results work out:
i the mode ii the median iii the range iv the mean.
c Compare and comment on the test results of both classes.
a Class 9A test results Class 9B test results The test results vary between 4 and 39,
so 0, 1, 2 and 3 need to form the stem. The
8 8 7 6 5 4 0 7 8 8 9 leaves for class 9A need to come out from the
stem, in order of size, to the left. The leaves for
5 5 4 4 0 1 2 3 4 7 8 8 9
class 9B come out from the stem, to the right.
6 6 6 5 3 2 0 1 1 1 5 Write a key for each set of data to explain how
9 4 4 3 3 2 2 3 3 the diagram works.
Key: For class 9A, 4 | 0 means 04 marks
For class 9B, 0 | 7 means 07 marks
b i Class 9A mode = 26 Look for the test result that appears the most often,
Class 9B mode = 21 and write down the mode for each set of data.
ii 20 students: median = 21 ÷ 2 = 10.5th value There are 20 students in each class, so the median
Class 9A: 10th = 15, 11th = 15, so median = 15 is the mean of the 10th and 11th students’ results.
Class 9B: 10th = 18, 11th = 19, so median = 18.5
iii Class 9A range = 39 – 4 = 35 Range is the difference between the highest result
Class 9B range = 33 – 7 = 26 and the lowest result.
iv Class 9A mean = 372 ÷ 20 = 18.6 To work out the mean, add all the scores together
Class 9B mean = 381 ÷ 20 = 19.05 then divide by the number of scores (20).
c On average, Class 9B had better results than class Write a few sentences comparing the test
9A as their median and mean were higher.The results of the two classes. Use the mode,
median shows that in Class 9B 50% of the students median, range and means that you have just
had a result greater than 18.5 compared to 15 for worked out and explain what they mean.
Class 9A. Class 9A had a higher modal (most Decide which class you think had the better
common) score than Class 9B. Class 9A had more results and give reasons for your answer.
variation in their scores as they had the higher range.
184 19 Interpreting and discussing results