
Page 190 - Cambridge+Checkpoint+Mathematics+Coursebook+9
P. 190
End-of-unit review
End-of-unit review
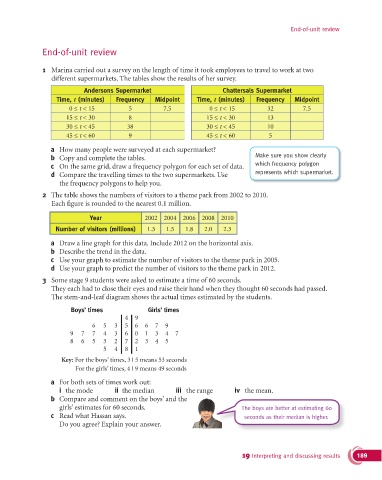
1 Marina carried out a survey on the length of time it took employees to travel to work at two
different supermarkets. The tables show the results of her survey.
Andersons Supermarket Chattersals Supermarket
Time, t (minutes) Frequency Midpoint Time, t (minutes) Frequency Midpoint
0 ≤ t < 15 5 7.5 0 ≤ t < 15 32 7.5
15 ≤ t < 30 8 15 ≤ t < 30 13
30 ≤ t < 45 38 30 ≤ t < 45 10
45 ≤ t < 60 9 45 ≤ t < 60 5
a How many people were surveyed at each supermarket?
b Copy and complete the tables. Make sure you show clearly
c On the same grid, draw a frequency polygon for each set of data. which frequency polygon
d Compare the travelling times to the two supermarkets. Use represents which supermarket.
the frequency polygons to help you.
2 The table shows the numbers of visitors to a theme park from 2002 to 2010.
Each figure is rounded to the nearest 0.1 million.
Year 2002 2004 2006 2008 2010
Number of visitors (millions) 1.3 1.5 1.8 2.0 2.3
a Draw a line graph for this data. Include 2012 on the horizontal axis.
b Describe the trend in the data.
c Use your graph to estimate the number of visitors to the theme park in 2005.
d Use your graph to predict the number of visitors to the theme park in 2012.
3 Some stage 9 students were asked to estimate a time of 60 seconds.
They each had to close their eyes and raise their hand when they thought 60 seconds had passed.
The stem-and-leaf diagram shows the actual times estimated by the students.
Boys’ times Girls’ times
4 9
6 5 3 5 6 6 7 9
9 7 7 4 3 6 0 1 3 4 7
8 6 5 3 2 7 2 3 4 5
5 4 8 1
Key: For the boys’ times, 3 | 5 means 53 seconds
For the girls’ times, 4 | 9 means 49 seconds
a For both sets of times work out:
i the mode ii the median iii the range iv the mean.
b Compare and comment on the boys’ and the
girls’ estimates for 60 seconds. The boys are better at estimating 60
c Read what Hassan says. seconds as their median is higher.
Do you agree? Explain your answer.
19 Interpreting and discussing results 189