
Page 186 - Cambridge+Checkpoint+Mathematics+Coursebook+9
P. 186
19.4 Interpreting and drawing stem-and-leaf diagrams
) Exercise 19.4
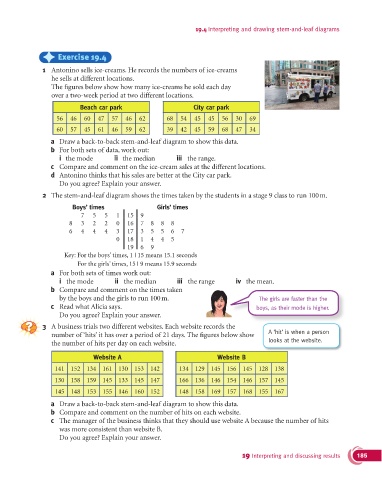
1 Antonino sells ice-creams. He records the numbers of ice-creams
he sells at different locations.
The figures below show how many ice-creams he sold each day
over a two-week period at two different locations.
Beach car park City car park
56 46 60 47 57 46 62 68 54 45 45 56 30 69
60 57 45 61 46 59 62 39 42 45 59 68 47 34
a Draw a back-to-back stem-and-leaf diagram to show this data.
b For both sets of data, work out:
i the mode ii the median iii the range.
c Compare and comment on the ice-cream sales at the different locations.
d Antonino thinks that his sales are better at the City car park.
Do you agree? Explain your answer.
2 The stem-and-leaf diagram shows the times taken by the students in a stage 9 class to run 100 m.
Boys’ times Girls’ times
7 5 5 1 15 9
8 3 2 2 0 16 7 8 8 8
6 4 4 4 3 17 3 5 5 6 7
0 18 1 4 4 5
19 6 9
Key: For the boys’ times, 1 | 15 means 15.1 seconds
For the girls’ times, 15 | 9 means 15.9 seconds
a For both sets of times work out:
i the mode ii the median iii the range iv the mean.
b Compare and comment on the times taken
by the boys and the girls to run 100 m. The girls are faster than the
c Read what Alicia says. boys, as their mode is higher.
Do you agree? Explain your answer.
3 A business trials two different websites. Each website records the
number of ‘hits’ it has over a period of 21 days. The figures below show A ‘hit’ is when a person
the number of hits per day on each website. looks at the website.
Website A Website B
141 152 134 161 130 153 142 134 129 145 156 145 128 138
130 158 159 145 133 145 147 166 136 146 154 146 157 145
145 148 153 155 146 160 152 148 158 169 157 168 155 167
a Draw a back-to-back stem-and-leaf diagram to show this data.
b Compare and comment on the number of hits on each website.
c The manager of the business thinks that they should use website A because the number of hits
was more consistent than website B.
Do you agree? Explain your answer.
19 Interpreting and discussing results 185