
Page 12 - Data Transparency White Paper_FINAL_Neat
P. 12
Addressing Biases in Multicultural & Inclusive Identity Data
12
over 400 million. Scale and big numbers are what marketers look for in target segments. It’s possible this is
the reason the two key quality issues, adequate coverage of demographic groups and accurate demographic
assignments, have been overlooked by marketers.
In the data provided by Truthset, only about half of the records (hashed emails) were assigned any race/
ethnicity. Similar to Nielsen’s findings, a large number of data assets are missing any race and ethnicity
identifiers, which cuts down the number of records available to multicultural marketers. Once again,
marketers don’t have the ability to #SeeALL.
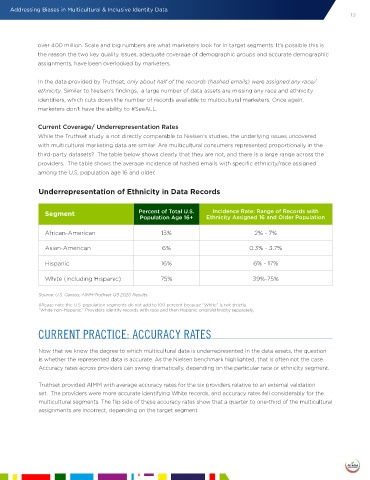
Current Coverage/ Underrepresentation Rates
While the Truthset study is not directly comparable to Nielsen’s studies, the underlying issues uncovered
with multicultural marketing data are similar. Are multicultural consumers represented proportionally in the
third-party datasets? The table below shows clearly that they are not, and there is a large range across the
providers. The table shows the average incidence of hashed emails with specific ethnicity/race assigned
among the U.S. population age 16 and older.
Underrepresentation of Ethnicity in Data Records
Segment Percent of Total U.S. Incidence Rate: Range of Records with
Population Age 16+ Ethnicity Assigned 16 and Older Population
African-American 13% 2% - 7%
Asian-American 6% 0.3% - 3.7%
Hispanic 16% 6% - 17%
White (including Hispanic) 75% 39%-75%
Source: U.S. Census, AIMM-Truthset Q3 2020 Results.
(Please note the U.S. population segments do not add to 100 percent because “White” is not strictly
“White non-Hispanic.” Providers identify records with race and then Hispanic origin/ethnicity separately.
CURRENT PRACTICE: ACCURACY RATES
Now that we know the degree to which multicultural data is underrepresented in the data assets, the question
is whether the represented data is accurate. As the Nielsen benchmark highlighted, that is often not the case.
Accuracy rates across providers can swing dramatically, depending on the particular race or ethnicity segment.
Truthset provided AIMM with average accuracy rates for the six providers relative to an external validation
set. The providers were more accurate identifying White records, and accuracy rates fell considerably for the
multicultural segments. The flip side of these accuracy rates show that a quarter to one-third of the multicultural
assignments are incorrect, depending on the target segment.