Page 9 - Data Transparency White Paper_FINAL_Neat
P. 9

Addressing Biases in Multicultural & Inclusive Identity Data
                                                                                                                     9


              A total of 10 providers were evaluated in the set of validation studies.


              Key Finding: Low Coverage and Inaccurate Multicultural Data
              Nielsen revealed two bias issues.
                 1.  Underrepresentation: Identity data is missing for a large number of homes Nielsen knows to be
                   multicultural.  This means the providers’ classification of ethnicity/race and language preference
                   did not match many of those diverse households.  Those households  are simply “not seen” and
                   underrepresented in the data. In the table below Coverage is reported as the average percent
                   of multicultural Nielsen homes found in the third-party data; the complement of the percent
                   underrepresented.


                 2.  Misclassification: The ethnicity/race assigned to the household record is incorrect. Accuracy measures
                   the correct classification of ethnicity and race.  The households or records are included in providers’
                   databases, but they are misclassified.


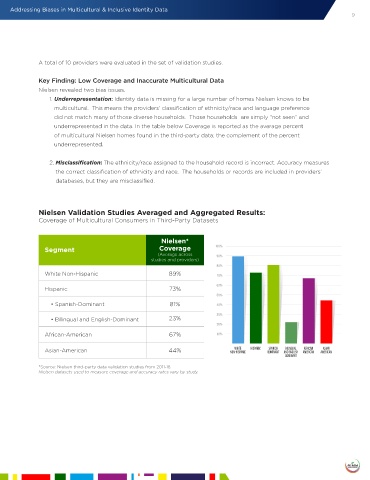
              Nielsen Validation Studies Averaged and Aggregated Results:
              Coverage of Multicultural Consumers in Third-Party Datasets


                                                      Nielsen*
                Segment                               Coverage          100%
                                                     (Average across     90%
                                                   studies and providers)
                                                                         80%
                White Non-Hispanic                       89%             70%
                                                                         60%
                Hispanic                                 73%
                                                                         50%
                  • Spanish-Dominant                     81%             40%
                                                                         30%
                  • Bilingual and English-Dominant       23%
                                                                         20%
                African-American                         67%             10%

                                                                                               BILINGUAL
                                                                                                      AFRICAN
                                                                                                            ASIAN
                                                                                          SPANISH
                                                                               WHITE
                Asian-American                           44%                 NON-HISPANIC  HISPANIC  DOMINANT  AND ENGLISH  AMERICAN  AMERICAN
                                                                                               DOMINANT
              *Source: Nielsen third-party data validation studies from 2011-18.
              Nielsen datasets used to measure coverage and accuracy rates vary by study.
   4   5   6   7   8   9   10   11   12   13   14