
Page 19 - Génome Québec - 2017-2018 Annual report
P. 19
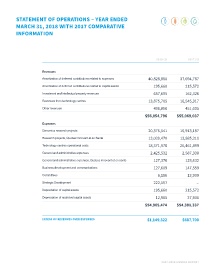
STATEMENT OF FINANCIAL POSITION   STATEMENT OF OPERATIONS – YEAR ENDED
 MARCH 31 2018, WITH COMPARATIVE   MARCH 31, 2018 WITH 2017 COMPARATIVE

 INFORMATION FOR 2017 (CONT’D)  INFORMATION


 LIABILITIES AND NET ASSETS  2018 ($)  2017 ($)                                           2018 ($)          2017 ($)


 Current liabilities     Revenues
 Accounts payable and accrued liabilities  2,927,043  3,757,975  Amortization of deferred contributions related to expenses   40,828,880  37,694,787

 Due to research projects  505,261  -  Amortization of deferred contributions related to capital assets  195,660  215,572
 Deferred revenues  461,841  351,076  Investment and intellectual property revenues     657,695           162,326

 $3,894,145  $4,109,051  Revenues from technology centres                            13,875,705        16,545,317

 Deferred contributions  Other revenues                                                 496,856           451,035
 Future expenses   52,016,323  60,387,129                                          $56,054,796       $55,069,037

 Capital assets   245,794  381,470  Expenses
 $52,262,117   $60,768,599  Genomics research projects                               20,376,541        16,913,187

                         Research projects, Québec Innovant et en Santé              13,039,470        13,885,311
 $56,156,262  $64,877,650  Technology centres operational costs                      18,371,978        20,461,899

                         General and administrative expenses                          2,425,532         2,587,338

 Net assets              General and administrative expenses, Québec Innovant et en santé  127,376        128,632

 Unrestricted  2,423,643  2,698,022  Business development and communications            127,609           147,559
 Restricted – Invested in capital assets   5,975  12,112  Committees                      6,186            13,909

 Restricted – Technology investment and contingency funds  1,577,133  735,096  Strategic Development  222,157   -
 Restricted – Research projects  662,388  74,587  Depreciation of capital assets        195,660           215,572

 $4,669,139  $3,519,817  Depreciation of restricted capital assets                       12,965            27,930

                                                                                   $54,905,474       $54,381,337
 $60,825,401  $68,397,467

                         EXCESS OF REVENUES OVER EXPENSES                            $1,149,322         $687,700


 018                                                                                         2017-2018 ANNUAL REPORT