
Page 176 - [Uma_Sekaran]_Research_methods_for_business__a_sk(BookZZ.org)
P. 176
160 EXPERIMENTAL DESIGNS
Figure 7.4
Posttest only with experimental and control groups.
Group Treatment Outcome
Experimental group X O 1
Control group O 2
Treatment effect = (O 1 – O 2 )
(the dropout of individuals from groups) can also confound the results, and thus
pose a threat to internal validity.
True Experimental Designs
Experimental designs, which include both the treatment and control groups and
record information both before and after the experimental group is exposed to
the treatment, are known as ex post facto experimental designs. These are dis-
cussed below.
Pretest and Posttest Experimental and Control Group Designs
This design can be visually depicted as in Figure 7.5. Two groups—one experi-
mental and the other control—are both exposed to the pretest and the posttest.
The only difference between the two groups is that the former is exposed to a
treatment whereas the latter is not. Measuring the difference between the differ-
ences in the post- and pretest scores of the two groups would give the net effects
of the treatment. Both groups have been exposed to both the pre- and posttests,
and both groups have been randomized; thus we could expect that the history,
maturation, testing, and instrumentation effects have been controlled. This is so
due to the fact that whatever happened with the experimental group (e.g., mat-
uration, history, testing, and instrumentation) also happened with the control
group, and in measuring the net effects (the difference in the differences
between the pre- and posttest scores) we have controlled these contaminating
factors. Through the process of randomization, we have also controlled the
effects of selection biases and statistical regression. Mortality could, however,
pose a problem in this design. In experiments that take several weeks, as in the
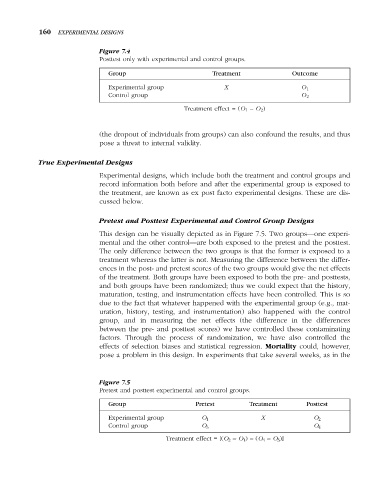
Figure 7.5
Pretest and posttest experimental and control groups.
Group Pretest Treatment Posttest
Experimental group O 1 X O 2
Control group O 3 O 4
Treatment effect = [(O 2 – O 1 ) – (O 4 – O 3 )]