Page 24 - Eden Meadow 35 houses application as of 12 October
P. 24

LAND TO THE REAR OF EDEN MEADOWS, NEWINGTON

                                                                     AIR QUALITY ASSESSMENT


                        Street Canyons


               4.14     A street canyon may be defined as a relatively narrow street with buildings on both sides,
                        where the height of the buildings is generally greater than the width of the road. Street canyons
                        may result in elevated pollutant concentrations from road traffic emissions due to a reduced

                        likelihood of the pollutants becoming dispersed in the atmosphere. Street canyons have been
                        modelled as part of this assessment along sections of the A2 High Street in both Newington
                        and Rainham.


                        Background Concentrations


                                                                                               10
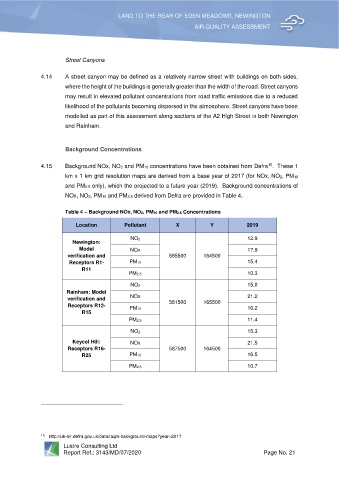
               4.15     Background NOx, NO2 and PM10 concentrations have been obtained from Defra .  These 1
                        km x 1 km grid resolution maps are derived from a base year of 2017 (for NOx, NO2, PM10
                        and PM2.5 only), which the projected to a future year (2019).  Background concentrations of
                        NOx, NO2, PM10 and PM2.5 derived from Defra are provided in Table 4.


                        Table 4 – Background NOx, NO2, PM10 and PM2.5 Concentrations

                            Location         Pollutant         X           Y            2019

                                               NO2                                      12.9
                          Newington:
                             Model             NOx                                      17.9
                         verification and                   585500       164500
                         Receptors R1-        PM10                                      15.4
                              R11
                                              PM2.5                                     10.3

                                               NO2                                      15.0
                        Rainham: Model
                         verification and      NOx          581500       165500         21.2
                         Receptors R12-       PM10                                      16.2
                              R15
                                              PM2.5                                     11.4

                                               NO2                                      15.3
                          Keycol Hill:         NOx                                      21.5
                         Receptors R16-                     587500       164500
                              R25             PM10                                      16.5

                                              PM2.5                                     10.7


               10    http://uk-air.defra.gov.uk/data/laqm-background-maps?year=2017
                       Lustre Consulting Ltd
                       Report Ref.: 3143/MD/07/2020                                           Page No. 21
   19   20   21   22   23   24   25   26   27   28   29