
Page 41 - Eden Meadow 35 houses application as of 12 October
P. 41
LAND TO THE REAR OF EDEN MEADOWS, NEWINGTON
AIR QUALITY ASSESSMENT
Model Adjustment
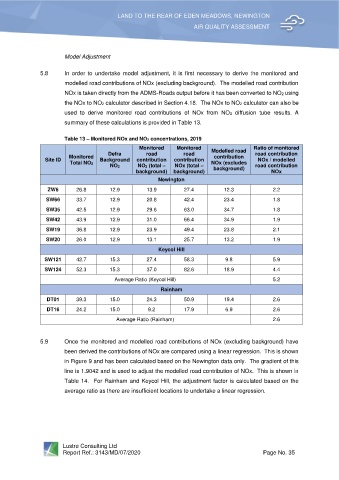
5.8 In order to undertake model adjustment, it is first necessary to derive the monitored and
modelled road contributions of NOx (excluding background). The modelled road contribution
NOx is taken directly from the ADMS-Roads output before it has been converted to NO2 using
the NOx to NO2 calculator described in Section 4.18. The NOx to NO2 calculator can also be
used to derive monitored road contributions of NOx from NO2 diffusion tube results. A
summary of these calculations is provided in Table 13.
Table 13 – Monitored NOx and NO2 concentrations, 2019
Monitored Monitored Modelled road Ratio of monitored
Defra road road road contribution
Monitored contribution
Site ID Background contribution contribution NOx / modelled
Total NO2 NOx (excludes
NO2 NO2 (total – NOx (total – background) road contribution
background) background) NOx
Newington
ZW6 26.8 12.9 13.9 27.4 12.3 2.2
SW66 33.7 12.9 20.8 42.4 23.4 1.8
SW35 42.5 12.9 29.6 63.0 34.7 1.8
SW42 43.9 12.9 31.0 66.4 34.9 1.9
SW19 36.8 12.9 23.9 49.4 23.8 2.1
SW20 26.0 12.9 13.1 25.7 13.2 1.9
Keycol Hill
SW121 42.7 15.3 27.4 58.3 9.8 5.9
SW124 52.3 15.3 37.0 82.6 18.9 4.4
Average Ratio (Keycol Hill) 5.2
Rainham
DT01 39.3 15.0 24.3 50.9 19.4 2.6
DT16 24.2 15.0 9.2 17.9 6.9 2.6
Average Ratio (Rainham) 2.6
5.9 Once the monitored and modelled road contributions of NOx (excluding background) have
been derived the contributions of NOx are compared using a linear regression. This is shown
in Figure 9 and has been calculated based on the Newington data only. The gradient of this
line is 1.9042 and is used to adjust the modelled road contribution of NOx. This is shown in
Table 14. For Rainham and Keycol Hill, the adjustment factor is calculated based on the
average ratio as there are insufficient locations to undertake a linear regression.
Lustre Consulting Ltd
Report Ref.: 3143/MD/07/2020 Page No. 35