
Page 43 - Eden Meadow 35 houses application as of 12 October
P. 43
LAND TO THE REAR OF EDEN MEADOWS, NEWINGTON
AIR QUALITY ASSESSMENT
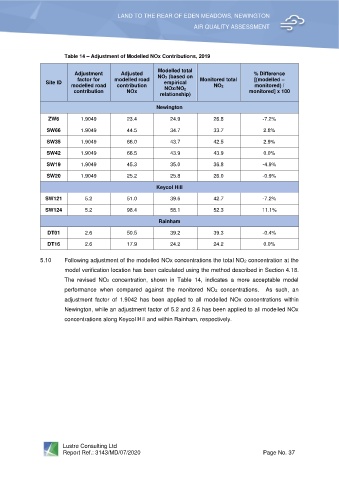
Table 14 – Adjustment of Modelled NOx Contributions, 2019
Modelled total
Adjustment Adjusted NO2 (based on % Difference
factor for modelled road Monitored total [(modelled –
Site ID empirical
modelled road contribution NOx/NO2 NO2 monitored) /
contribution NOx monitored] x 100
relationship)
Newington
ZW6 1.9049 23.4 24.9 26.8 -7.2%
SW66 1.9049 44.5 34.7 33.7 2.8%
SW35 1.9049 66.0 43.7 42.5 2.9%
SW42 1.9049 66.5 43.9 43.9 0.0%
SW19 1.9049 45.3 35.0 36.8 -4.9%
SW20 1.9049 25.2 25.8 26.0 -0.9%
Keycol Hill
SW121 5.2 51.0 39.6 42.7 -7.2%
SW124 5.2 98.4 58.1 52.3 11.1%
Rainham
DT01 2.6 50.5 39.2 39.3 -0.4%
DT16 2.6 17.9 24.2 24.2 0.0%
5.10 Following adjustment of the modelled NOx concentrations the total NO2 concentration at the
model verification location has been calculated using the method described in Section 4.18.
The revised NO2 concentration, shown in Table 14, indicates a more acceptable model
performance when compared against the monitored NO2 concentrations. As such, an
adjustment factor of 1.9042 has been applied to all modelled NOx concentrations within
Newington, while an adjustment factor of 5.2 and 2.6 has been applied to all modelled NOx
concentrations along Keycol Hill and within Rainham, respectively.
Lustre Consulting Ltd
Report Ref.: 3143/MD/07/2020 Page No. 37