Page 45 - Eden Meadow 35 houses application as of 12 October
P. 45

LAND TO THE REAR OF EDEN MEADOWS, NEWINGTON

                                                                     AIR QUALITY ASSESSMENT


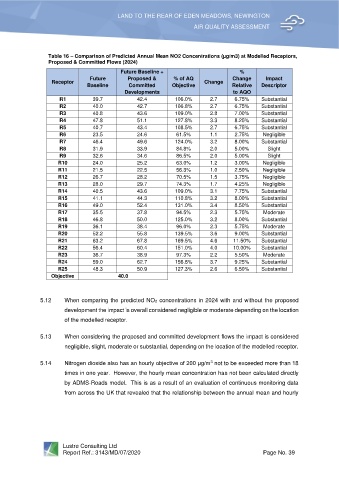
                  Table 16 – Comparison of Predicted Annual Mean NO2 Concentrations (µg/m3) at Modelled Receptors,
                  Proposed & Committed Flows (2024)
                                           Future Baseline +                         %
                                 Future       Proposed &      % of AQ              Change     Impact
                   Receptor                                              Change
                                Baseline      Committed      Objective             Relative   Descriptor
                                             Developments                          to AQO
                      R1          39.7           42.4         106.0%       2.7     6.75%     Substantial
                      R2          40.0           42.7         106.8%       2.7     6.75%     Substantial
                      R3          40.8           43.6         109.0%       2.8     7.00%     Substantial
                      R4          47.8           51.1         127.8%       3.3     8.25%     Substantial
                      R5          40.7           43.4         108.5%       2.7     6.75%     Substantial
                      R6          23.5           24.6          61.5%       1.1     2.75%     Negligible
                      R7          46.4           49.6         124.0%       3.2     8.00%     Substantial
                      R8          31.9           33.9          84.8%       2.0     5.00%       Slight
                      R9          32.6           34.6          86.5%       2.0     5.00%       Slight
                     R10          24.0           25.2          63.0%       1.2     3.00%     Negligible
                     R11          21.5           22.5          56.3%       1.0     2.50%     Negligible
                     R12          26.7           28.2          70.5%       1.5     3.75%     Negligible
                     R13          28.0           29.7          74.3%       1.7     4.25%     Negligible
                     R14          40.5           43.6         109.0%       3.1     7.75%     Substantial
                     R15          41.1           44.3         110.8%       3.2     8.00%     Substantial
                     R16          49.0           52.4         131.0%       3.4     8.50%     Substantial
                     R17          35.5           37.8          94.5%       2.3     5.75%     Moderate
                     R18          46.8           50.0         125.0%       3.2     8.00%     Substantial
                     R19          36.1           38.4          96.0%       2.3     5.75%     Moderate
                     R20          52.2           55.8         139.5%       3.6     9.00%     Substantial
                     R21          63.2           67.8         169.5%       4.6     11.50%    Substantial
                     R22          56.4           60.4         151.0%       4.0     10.00%    Substantial
                     R23          36.7           38.9          97.3%       2.2     5.50%     Moderate
                     R24          59.0           62.7         156.8%       3.7     9.25%     Substantial
                     R25          48.3           50.9         127.3%       2.6     6.50%     Substantial
                   Objective               40.0


               5.12     When comparing the predicted NO2 concentrations in 2024 with and without the proposed
                        development the impact is overall considered negligible or moderate depending on the location
                        of the modelled receptor.


               5.13     When considering the proposed and committed development flows the impact is considered
                        negligible, slight, moderate or substantial, depending on the location of the modelled receptor.


                                                                           3
               5.14     Nitrogen dioxide also has an hourly objective of 200 μg/m  not to be exceeded more than 18
                        times in one year.  However, the hourly mean concentration has not been calculated directly
                        by ADMS-Roads model.  This is as a result of an evaluation of continuous monitoring data
                        from across the UK that revealed that the relationship between the annual mean and hourly


                       Lustre Consulting Ltd
                       Report Ref.: 3143/MD/07/2020                                          Page No. 39
   40   41   42   43   44   45   46   47   48   49   50