
Page 241 - Dimensi Baharu Zakat di Malaysia
P. 241
© DIMENSI BAHARU ZAKAT DI MALAYSIA
ISBN 978-967-2959-04-5
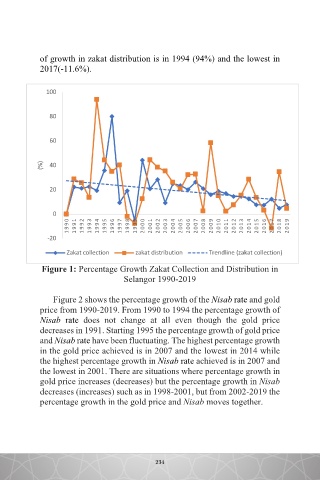
of growth in zakat distribution is in 1994 (94%) and the lowest in
2017(-11.6%).
100
80
60
(%) 40
20
0
1 9 9 0 1 9 9 1 1 9 9 2 1 9 9 3 1 9 9 4 1 9 9 5 1 9 9 6 1 9 9 7 1 9 9 8 1 9 9 9 2 0 0 0 2 0 0 1 2 0 0 2 2 0 0 3 2 0 0 4 2 0 0 5 2 0 0 6 2 0 0 7 2 0 0 8 2 0 0 9 2 0 1 0 2 0 1 1 2 0 1 2 2 0 1 3 2 0 1 4 2 0 1 5 2 0 1 6 2 0 1 7 2 0 1 8 2 0 1 9
-20
Zakat collection zakat distribution Trendline (zakat collection)
Figure 1: Percentage Growth Zakat Collection and Distribution in
Selangor 1990-2019
Figure 2 shows the percentage growth of the Nisab rate and gold
price from 1990-2019. From 1990 to 1994 the percentage growth of
Nisab rate does not change at all even though the gold price
decreases in 1991. Starting 1995 the percentage growth of gold price
and Nisab rate have been fluctuating. The highest percentage growth
in the gold price achieved is in 2007 and the lowest in 2014 while
the highest percentage growth in Nisab rate achieved is in 2007 and
the lowest in 2001. There are situations where percentage growth in
gold price increases (decreases) but the percentage growth in Nisab
decreases (increases) such as in 1998-2001, but from 2002-2019 the
percentage growth in the gold price and Nisab moves together.
233
234