
Page 243 - Dimensi Baharu Zakat di Malaysia
P. 243
© DIMENSI BAHARU ZAKAT DI MALAYSIA
ISBN 978-967-2959-04-5
90
80
70
60
50
40
(%) 30
20
10
0
-10 1 9 9 0 1 9 9 1 1 9 9 2 1 9 9 3 1 9 9 4 1 9 9 5 1 9 9 6 1 9 9 7 1 9 9 8 1 9 9 9 2 0 0 0 2 0 0 1 2 0 0 2 2 0 0 3 2 0 0 4 2 0 0 5 2 0 0 6 2 0 0 7 2 0 0 8 2 0 0 9 2 0 1 0 2 0 1 1 2 0 1 2 2 0 1 3 2 0 1 4 2 0 1 5 2 0 1 6 2 0 1 7 2 0 1 8 2 0 1 9
-20
Zakat collection GDP growth Inflation rate
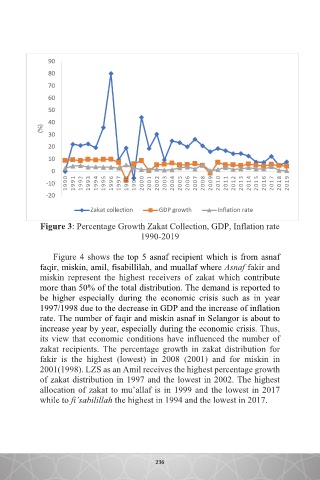
Figure 3: Percentage Growth Zakat Collection, GDP, Inflation rate
1990-2019
Figure 4 shows the top 5 asnaf recipient which is from asnaf
faqir, miskin, amil, fisabillilah, and muallaf where Asnaf fakir and
miskin represent the highest receivers of zakat which contribute
more than 50% of the total distribution. The demand is reported to
be higher especially during the economic crisis such as in year
1997/1998 due to the decrease in GDP and the increase of inflation
rate. The number of faqir and miskin asnaf in Selangor is about to
increase year by year, especially during the economic crisis. Thus,
its view that economic conditions have influenced the number of
zakat recipients. The percentage growth in zakat distribution for
fakir is the highest (lowest) in 2008 (2001) and for miskin in
2001(1998). LZS as an Amil receives the highest percentage growth
of zakat distribution in 1997 and the lowest in 2002. The highest
allocation of zakat to mu’allaf is in 1999 and the lowest in 2017
while to fi’sabilillah the highest in 1994 and the lowest in 2017.
235
236