
Page 242 - Dimensi Baharu Zakat di Malaysia
P. 242
© DIMENSI BAHARU ZAKAT DI MALAYSIA
ISBN 978-967-2959-04-5
40
30
20
10
(%)
0
1 9 9 0 1 9 9 1 1 9 9 2 1 9 9 3 1 9 9 4 1 9 9 5 1 9 9 6 1 9 9 7 1 9 9 8 1 9 9 9 2 0 0 0 2 0 0 1 2 0 0 2 2 0 0 3 2 0 0 4 2 0 0 5 2 0 0 6 2 0 0 7 2 0 0 8 2 0 0 9 2 0 1 0 2 0 1 1 2 0 1 2 2 0 1 3 2 0 1 4 2 0 1 5 2 0 1 6 2 0 1 7 2 0 1 8 2 0 1 9
-10
-20
-30
Gold Price Nisab
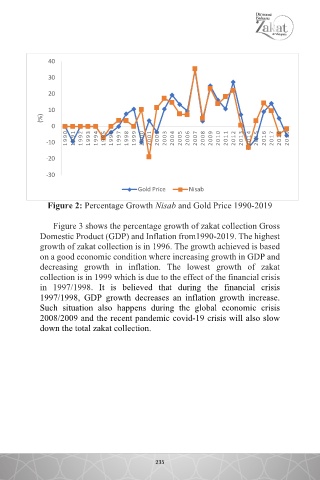
Figure 2: Percentage Growth Nisab and Gold Price 1990-2019
Figure 3 shows the percentage growth of zakat collection Gross
Domestic Product (GDP) and Inflation from1990-2019. The highest
growth of zakat collection is in 1996. The growth achieved is based
on a good economic condition where increasing growth in GDP and
decreasing growth in inflation. The lowest growth of zakat
collection is in 1999 which is due to the effect of the financial crisis
in 1997/1998. It is believed that during the financial crisis
1997/1998, GDP growth decreases an inflation growth increase.
Such situation also happens during the global economic crisis
2008/2009 and the recent pandemic covid-19 crisis will also slow
down the total zakat collection.
234
235