Page 491 - ACFE Fraud Reports 2009_2020
P. 491
Introduction


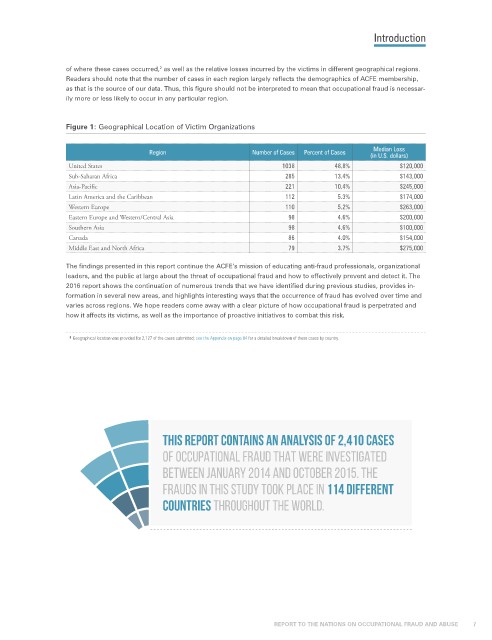
                 of where these cases occurred,  as well as the relative losses incurred by the victims in different geographical regions.
                                        2
                 Readers should note that the number of cases in each region largely reflects the demographics of ACFE membership,
                 as that is the source of our data. Thus, this figure should not be interpreted to mean that occupational fraud is necessar-
                 ily more or less likely to occur in any particular region.


                 Figure 1: Geographical Location of Victim Organizations

                                                                                             Median Loss
                                      Region                   Number of Cases  Percent of Cases  (in U.S. dollars)
                  United States                                       1038         48.8%           $120,000
                  Sub-Saharan Africa                                   285         13.4%           $143,000
                  Asia-Pacific                                         221         10.4%           $245,000
                  Latin America and the Caribbean                      112          5.3%           $174,000
                  Western Europe                                       110          5.2%           $263,000
                  Eastern Europe and Western/Central Asia               98          4.6%           $200,000
                  Southern Asia                                         98          4.6%           $100,000
                  Canada                                                86          4.0%           $154,000
                  Middle East and North Africa                          79          3.7%           $275,000

                 The findings presented in this report continue the ACFE’s mission of educating anti-fraud professionals, organizational
                 leaders, and the public at large about the threat of occupational fraud and how to effectively prevent and detect it. The
                 2016 report shows the continuation of numerous trends that we have identified during previous studies, provides in-
                 formation in several new areas, and highlights interesting ways that the occurrence of fraud has evolved over time and
                 varies across regions. We hope readers come away with a clear picture of how occupational fraud is perpetrated and
                 how it affects its victims, as well as the importance of proactive initiatives to combat this risk.

                  2   Geographical location was provided for 2,127 of the cases submitted; see the Appendix on page 84 for a detailed breakdown of these cases by country.


                                         THIS REPORT CONTAINS AN ANALYSIS OF 2,410 CASES

                                         OF OCCUPATIONAL FRAUD THAT WERE INVESTIGATED
                                         BETWEEN JANUARY 2014 AND OCTOBER 2015. THE

                                         FRAUDS IN THIS STUDY TOOK PLACE IN 114 DIFFERENT
                                         COUNTRIES THROUGHOUT THE WORLD.


                                                                    REPORT TO THE NATIONS ON OCCUPATIONAL FRAUD AND ABUSE           7

