Page 515 - ACFE Fraud Reports 2009_2020
P. 515
Victim Organizations


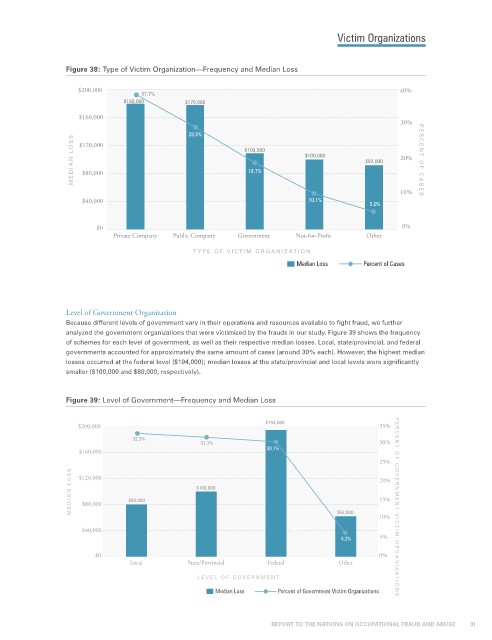
                 Figure 38: Type of Victim Organization—Frequency and Median Loss

                    $200,000                                                                       40%
                                    37.7%
                               $180,000       $178,000
                    $160,000
                                                                                                   30%
                                               28.6%
                   MEDIAN L OSS  $80,000                     $109,000       $100,000       $92,000  20%  PERCENT OF CASES
                    $120,000


                                                              18.7%

                                                                                                   10%
                     $40,000                                                 10.1%
                                                                                            5.0%

                         $0                                                                         0%
                             Private Company  Public Company   Government   Not-for-Profit   Other

                                                TYPE OF VICTIM ORGANIZATION
                                                                          Median Loss     Percent of Cases


                 Level of Government Organization
                 Because different levels of government vary in their operations and resources available to fight fraud, we further
                 analyzed the government organizations that were victimized by the frauds in our study. Figure 39 shows the frequency
                 of schemes for each level of government, as well as their respective median losses. Local, state/provincial, and federal
                 governments accounted for approximately the same amount of cases (around 30% each). However, the highest median
                 losses occurred at the federal level ($194,000); median losses at the state/provincial and local levels were significantly
                 smaller ($100,000 and $80,000, respectively).


                 Figure 39: Level of Government—Frequency and Median Loss


                                                                  $194,000
                    $200,000                                                                  35%
                                  32.3%
                                                  31.3%                                       30%
                    $160,000                                      30.1%
                                                                                              25%
                  MEDIAN L OSS  $120,000  $80,000  $100,000                                   20%


                                                                                              15%
                     $80,000
                                                                                    $62,000
                                                                                              10%  PERCENT OF GO VERNMENT VICTIM ORGANIZATIONS
                     $40,000                                            10.1%
                                                                                     6.3%     5%
                        $0                                                                    0%
                                 Local         State/Provincial    Federal          Other
                                                 LEVEL OF GO VERNMENT
                                                      Median Loss    Percent of Government Victim Organizations


                                                                    REPORT TO THE NATIONS ON OCCUPATIONAL FRAUD AND ABUSE           31

