
Page 520 - ACFE Fraud Reports 2009_2020
P. 520
Victim Organizations
Schemes by Industry
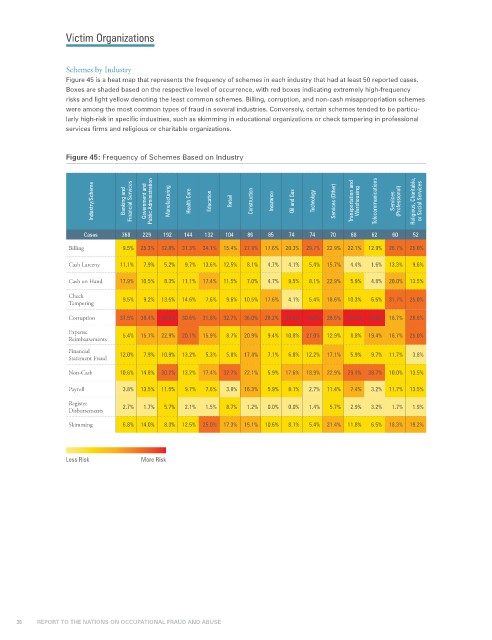
Figure 45 is a heat map that represents the frequency of schemes in each industry that had at least 50 reported cases.
Boxes are shaded based on the respective level of occurrence, with red boxes indicating extremely high-frequency
risks and light yellow denoting the least common schemes. Billing, corruption, and non-cash misappropriation schemes
were among the most common types of fraud in several industries. Conversely, certain schemes tended to be particu-
larly high-risk in specific industries, such as skimming in educational organizations or check tampering in professional
services firms and religious or charitable organizations.
Figure 45: Frequency of Schemes Based on Industry
Industry/Scheme Banking and Financial Services Government and Public Administration Manufacturing Health Care Education Retail Construction Insurance Oil and Gas Technology Services (Other) Transportation and Warehousing Telecommunications Services (Professional) Religious, Charitable, or Social Services
Cases 368 229 192 144 132 104 86 85 74 74 70 68 62 60 52
Billing 9.5% 25.3% 32.8% 31.3% 34.1% 15.4% 27.9% 17.6% 20.3% 29.7% 22.9% 22.1% 12.9% 26.7% 25.0%
Cash Larceny 11.1% 7.9% 5.2% 9.7% 13.6% 12.5% 8.1% 4.7% 4.1% 5.4% 15.7% 4.4% 1.6% 13.3% 9.6%
Cash on Hand 17.9% 10.5% 8.3% 11.1% 17.4% 11.5% 7.0% 4.7% 9.5% 8.1% 22.9% 5.9% 4.8% 20.0% 13.5%
Check
Tampering 9.5% 9.2% 13.5% 14.6% 7.6% 9.6% 10.5% 17.6% 4.1% 5.4% 18.6% 10.3% 6.5% 31.7% 25.0%
Corruption 37.5% 38.4% 48.4% 30.6% 31.8% 32.7% 36.0% 28.2% 48.6% 44.6% 28.6% 51.5% 41.9% 16.7% 28.8%
Expense
Reimbursements 5.4% 15.7% 22.9% 20.1% 15.9% 8.7% 20.9% 9.4% 10.8% 27.0% 12.9% 8.8% 19.4% 16.7% 25.0%
Financial 12.0% 7.9% 10.9% 13.2% 5.3% 5.8% 17.4% 7.1% 6.8% 12.2% 17.1% 5.9% 9.7% 11.7% 3.8%
Statement Fraud
Non-Cash 10.6% 14.8% 30.2% 13.2% 17.4% 32.7% 22.1% 5.9% 17.6% 18.9% 22.9% 29.4% 38.7% 10.0% 13.5%
Payroll 3.8% 13.5% 11.5% 9.7% 7.6% 3.8% 16.3% 5.9% 8.1% 2.7% 11.4% 7.4% 3.2% 11.7% 13.5%
Register 2.7% 1.7% 5.7% 2.1% 1.5% 8.7% 1.2% 0.0% 0.0% 1.4% 5.7% 2.9% 3.2% 1.7% 1.9%
Disbursements
Skimming 6.8% 14.0% 8.3% 12.5% 25.0% 17.3% 15.1% 10.6% 8.1% 5.4% 21.4% 11.8% 6.5% 18.3% 19.2%
Less Risk More Risk
36 REPORT TO THE NATIONS ON OCCUPATIONAL FRAUD AND ABUSE