Page 521 - ACFE Fraud Reports 2009_2020
P. 521

Victim Organizations


                 Corruption Cases by Industry
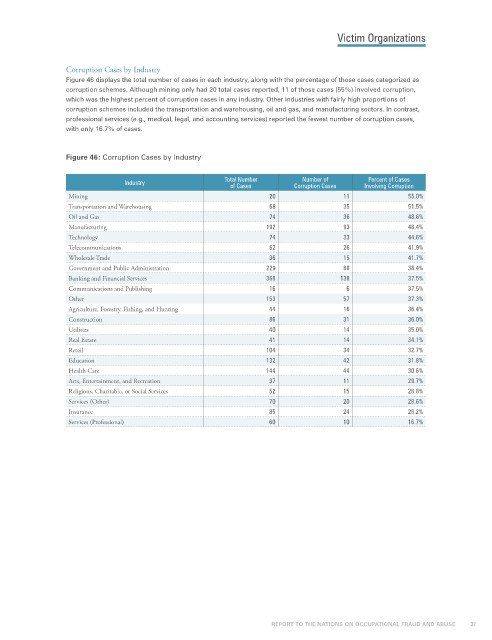
                 Figure 46 displays the total number of cases in each industry, along with the percentage of those cases categorized as
                 corruption schemes. Although mining only had 20 total cases reported, 11 of those cases (55%) involved corruption,
                 which was the highest percent of corruption cases in any industry. Other industries with fairly high proportions of
                 corruption schemes included the transportation and warehousing, oil and gas, and manufacturing sectors. In contrast,
                 professional services (e.g., medical, legal, and accounting services) reported the fewest number of corruption cases,
                 with only 16.7% of cases.


                 Figure 46: Corruption Cases by Industry


                                                                           Number of
                                                                                           Percent of Cases
                                Industry                Total Number     Corruption Cases  Involving Corruption
                                                         of Cases
                  Mining                                           20                11              55.0%
                  Transportation and Warehousing                   68                35              51.5%
                  Oil and Gas                                      74                36              48.6%
                  Manufacturing                                   192                93              48.4%
                  Technology                                       74                33              44.6%
                  Telecommunications                               62                26              41.9%
                  Wholesale Trade                                  36                15              41.7%
                  Government and Public Administration            229                88              38.4%
                  Banking and Financial Services                  368               138              37.5%
                  Communications and Publishing                    16                 6              37.5%
                  Other                                           153                57              37.3%
                  Agriculture, Forestry, Fishing, and Hunting      44                16              36.4%
                  Construction                                     86                31              36.0%
                  Utilities                                        40                14              35.0%
                  Real Estate                                      41                14              34.1%
                  Retail                                          104                34              32.7%
                  Education                                       132                42              31.8%
                  Health Care                                     144                44              30.6%
                  Arts, Entertainment, and Recreation              37                11              29.7%
                  Religious, Charitable, or Social Services        52                15              28.8%
                  Services (Other)                                 70                20              28.6%
                  Insurance                                        85                24              28.2%
                  Services (Professional)                          60                10              16.7%


                                                                    REPORT TO THE NATIONS ON OCCUPATIONAL FRAUD AND ABUSE           37
   516   517   518   519   520   521   522   523   524   525   526