Page 524 - ACFE Fraud Reports 2009_2020
P. 524
Victim Organizations


                                                                           Anti-Fraud Controls by Region
                    Trends in the Implementation of                        Regional variations in the implemen-
                                                                           tation rates of anti-fraud controls
                    Anti-Fraud Controls                                    provide both an interesting perspective
                                                                           regarding what organizations around
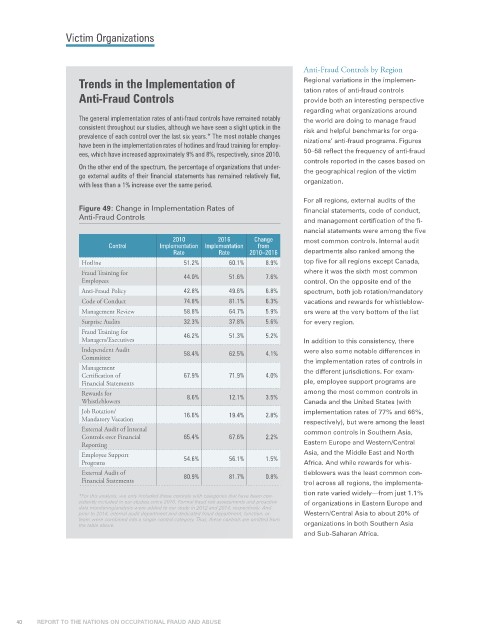
                    The general implementation rates of anti-fraud controls have remained notably   the world are doing to manage fraud
                    consistent throughout our studies, although we have seen a slight uptick in the   risk and helpful benchmarks for orga-
                    prevalence of each control over the last six years.* The most notable changes
                    have been in the implementation rates of hotlines and fraud training for employ-  nizations’ anti-fraud programs. Figures
                    ees, which have increased approximately 9% and 8%, respectively, since 2010.   50–58 reflect the frequency of anti-fraud
                                                                           controls reported in the cases based on
                    On the other end of the spectrum, the percentage of organizations that under-
                    go external audits of their financial statements has remained relatively flat,   the geographical region of the victim
                    with less than a 1% increase over the same period.     organization.
                                                                           For all regions, external audits of the
                    Figure 49: Change in Implementation Rates of           financial statements, code of conduct,
                    Anti-Fraud Controls                                    and management certification of the fi-

                                                                           nancial statements were among the five
                                           2010       2016     Change      most common controls. Internal audit
                            Control     Implementation  Implementation   from
                                            Rate       Rate   2010–2016    departments also ranked among the
                     Hotline                  51.2%      60.1%    8.9%     top five for all regions except Canada,
                     Fraud Training for       44.0%      51.6%    7.6%     where it was the sixth most common
                     Employees                                             control. On the opposite end of the
                     Anti-Fraud Policy        42.8%      49.6%    6.8%     spectrum, both job rotation/mandatory
                     Code of Conduct          74.8%      81.1%    6.3%     vacations and rewards for whistleblow-
                     Management Review        58.8%      64.7%    5.9%     ers were at the very bottom of the list
                     Surprise Audits          32.3%      37.8%    5.6%     for every region.
                     Fraud Training for       46.2%      51.3%    5.2%
                     Managers/Executives                                   In addition to this consistency, there
                     Independent Audit        58.4%      62.5%    4.1%     were also some notable differences in
                     Committee                                             the implementation rates of controls in
                     Management                                            the different jurisdictions. For exam-
                     Certification of         67.9%      71.9%    4.0%
                     Financial Statements                                  ple, employee support programs are
                     Rewards for               8.6%      12.1%    3.5%     among the most common controls in
                     Whistleblowers                                        Canada and the United States (with
                     Job Rotation/            16.6%      19.4%    2.8%     implementation rates of 77% and 66%,
                     Mandatory Vacation                                    respectively), but were among the least
                     External Audit of Internal                            common controls in Southern Asia,
                     Controls over Financial   65.4%     67.6%    2.2%
                     Reporting                                             Eastern Europe and Western/Central
                     Employee Support         54.6%      56.1%    1.5%     Asia, and the Middle East and North
                     Programs                                              Africa. And while rewards for whis-
                     External Audit of        80.9%      81.7%    0.8%     tleblowers was the least common con-
                     Financial Statements                                  trol across all regions, the implementa-
                                                                           tion rate varied widely—from just 1.1%
                    *For this analysis, we only included those controls with categories that have been con-
                    sistently included in our studies since 2010. Formal fraud risk assessments and proactive   of organizations in Eastern Europe and
                    data monitoring/analysis were added to our study in 2012 and 2014, respectively. And
                    prior to 2014, internal audit department and dedicated fraud department, function, or   Western/Central Asia to about 20% of
                    team were combined into a single control category. Thus, these controls are omitted from
                    the table above.                                       organizations in both Southern Asia
                                                                           and Sub-Saharan Africa.


     40           REPORT TO THE NATIONS ON OCCUPATIONAL FRAUD AND ABUSE

