Page 518 - ACFE Fraud Reports 2009_2020
P. 518
Victim Organizations


                 Industry of Organization
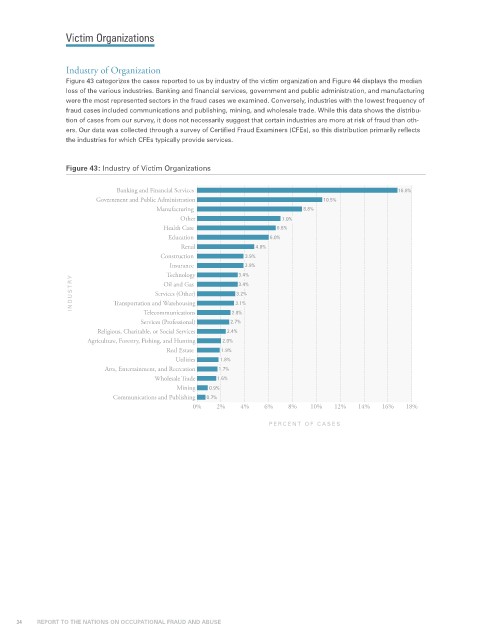
                 Figure 43 categorizes the cases reported to us by industry of the victim organization and Figure 44 displays the median
                 loss of the various industries. Banking and financial services, government and public administration, and manufacturing
                 were the most represented sectors in the fraud cases we examined. Conversely, industries with the lowest frequency of
                 fraud cases included communications and publishing, mining, and wholesale trade. While this data shows the distribu-
                 tion of cases from our survey, it does not necessarily suggest that certain industries are more at risk of fraud than oth-
                 ers. Our data was collected through a survey of Certified Fraud Examiners (CFEs), so this distribution primarily reflects
                 the industries for which CFEs typically provide services.


                 Figure 43: Industry of Victim Organizations

                              Banking and Financial Services                                       16.8%
                         Government and Public Administration                   10.5%
                                       Manufacturing                       8.8%
                                             Other                    7.0%
                                         Health Care                 6.6%
                                          Education                6.0%
                                             Retail             4.8%
                                        Construction         3.9%
                                           Insurance         3.9%
                                          Technology       3.4%
                   INDUSTR Y  Transportation and Warehousing  3.1%
                                         Oil and Gas
                                                           3.4%
                                                           3.2%
                                       Services (Other)
                                    Telecommunications    2.8%
                                   Services (Professional)  2.7%
                         Religious, Charitable, or Social Services  2.4%
                      Agriculture, Forestry, Fishing, and Hunting  2.0%
                                          Real Estate   1.9%
                                            Utilities  1.8%
                           Arts, Entertainment, and Recreation  1.7%
                                       Wholesale Trade  1.6%
                                            Mining  0.9%
                             Communications and Publishing  0.7%
                                                0%    2%    4%    6%    8%   10%   12%   14%   16%  18%
                                                                   PERCENT OF CASES


     34           REPORT TO THE NATIONS ON OCCUPATIONAL FRAUD AND ABUSE

