
Page 731 - ACFE Fraud Reports 2009_2020
P. 731
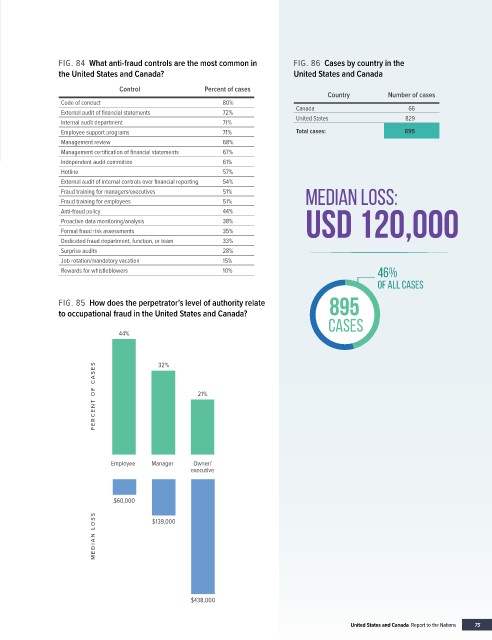
FIG. 84  What anti-fraud controls are the most common in   FIG. 86  Cases by country in the
               the United States and Canada?                             United States and Canada

                              Control              Percent of cases
                                                                                 Country        Number of cases
                Code of conduct                         80%
                External audit of financial statements  72%               Canada                     66
                Internal audit department               71%               United States             829
                                                                          Total cases:
                Employee support programs               71%      Median Loss United States and Canada?  895
                Management review                       68%
                Management certification of financial statements  67%
                Independent audit committee             61%
                Hotline                                 57%
                External audit of internal controls over financial reporting  54%
                Fraud training for managers/executives  51%                 MEDIAN LOSS:
                Fraud training for employees            51%
                Anti-fraud policy                       44%
                   How does the perpetrator's level of authority relate to
                Proactive data monitoring/analysis      38%                 usd 120,000
                   occupational fraud in the United States and Canada?
                Formal fraud risk assessments           35%
                Dedicated fraud department, function, or team  33%
                Surprise audits                         28%
                Job rotation/mandatory vacation         15%
                Rewards for whistleblowers              10%                                   46%
                                                                                              OF ALL CASES
               FIG. 85  How does the perpetrator’s level of authority relate   �               � � � �
               to occupational fraud in the United States and Canada?             895

                              44%                                                 CASES
                         45
                         40
                         35             32%
                        PERCENT OF C A SES  25   21%
                         30


                         20
                         15
                         10
                         5
                         0
                            Employee   Manager   Owner/
                                                executive


                             $60,000

                        MEDIAN L OSS  $139,000


                                                $438,000
                     $450000

                                                                                        United States and Canada  Report to the Nations  75