
Page 121 - FlipBook BACK FROM SARAN - MAY 5 2020 - Don't Make Me Say I Told You So_6.14x9.21_v9_Neat
P. 121
Don’t Make Me Say I Told You So 107
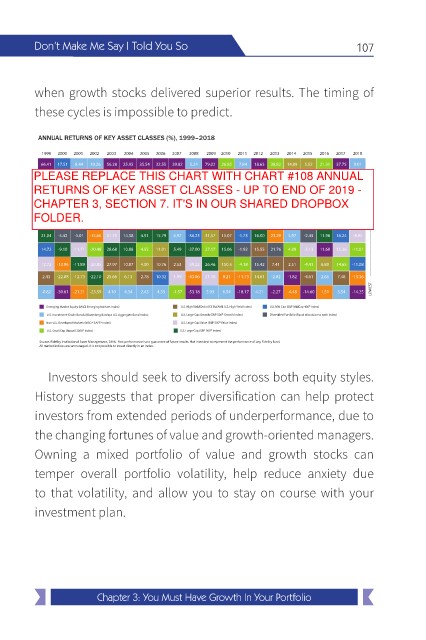
when growth stocks delivered superior results. The timing of
these cycles is impossible to predict.
ANNUAL RETURNS OF KEY ASSET CLASSES (%), 1999–2018
1999 2000 2001 2002 2003 2004 2005 2006 2007 2008 2009 2010 2011 2012 2013 2014 2015 2016 2017 2018
66.41 17.51 8.44 10.26 56.28 25.95 35.54 32.55 39.82 5.24 79.02 26.85 7.84 18.63 38.82 14.89 5.52 21.31 37.75 0.01
PLEASE REPLACE THIS CHART WITH CHART #108 ANNUAL
58.10
-26.11
26.64
20.25
11.63
47.25
-0.53
4.48
20.70
26.86
14.02
11.63
1.38
20.74
33.50
13.69
17.90
4.65
-0.01
27.44
32.75END OF 2019 -
RETURNS OF KEY ASSET CLASSES - UP TO 12.36 0.55 17.49 25.62 -2.27
37.38
39.17
-6.00
19.20
4.37
-33.14
12.56
20.80
9.33
17.88
18.33
2.49
27.30
6.08
CHAPTER 3, SECTION 7. IT'S IN OUR SHARED DROPBOX -4.38
17.68
9.13
32.39
18.37
9.77
35.47
21.48
-33.79
2.11
16.41
-0.39
35.62
-3.02
-12.61
-0.61
21.83
17.40
9.51
16.48
FOLDER. -14.53 32.95 15.71 5.82 16.75 7.98 -34.92 32.46 15.10 -0.48 16.35 31.99 6.42 -2.18 12.39 18.88 -7.26
-2.37
-5.19
21.26
21.04 -5.42 -5.01 -15.66 31.79 14.38 4.91 15.79 6.97 -36.23 31.57 15.07 -1.73 16.00 23.29 5.97 -2.43 11.96 16.24 -8.95 LOWEST ------------------------------------------------------------------------ HIGHEST
14.72 -9.10 -11.71 -20.48 28.68 10.88 4.55 11.01 5.49 -37.00 27.17 15.06 -1.92 15.55 21.76 4.89 -3.13 11.60 15.36 -11.01
12.72 -13.96 -11.89 -20.85 27.97 10.87 4.00 10.76 2.53 -39.22 26.46 150.5 -4.18 15.42 7.41 2.51 -4.41 6.89 14.65 -11.08
2.43 -22.08 -12.73 -22.10 25.66 6.13 2.78 10.32 1.99 -43.06 21.18 8.21 -11.73 14.61 -2.02 -1.82 -4.61 2.65 7.48 -13.36
-0.82 -30.61 -21.21 -23.59 4.10 4.34 2.43 4.33 -1.57 -53.18 5.93 6.54 -18.17 4.21 -2.27 -4.48 -14.60 1.51 3.54 -14.25
Emerging Market Equity (MSCI Emerging Markets Index) U.S. High Yield Debt (ICE BofAML U.S. High Yield Index) U.S. Mid Cap (S&P MidCap 400® Index)
U.S. Investment-Grade Bonds (Bloomberg Barclays U.S. Aggregate Bond Index) U.S. Large Cap Growth (S&P 500® Growth Index) Diversi ed Portfolio (Equal allocation to each index)
Non-U.S. Developed-Markets (MSCI® EAFE® Index) U.S. Large Cap Value (S&P 500® Value Index)
U.S. Small Cap (Russell 2000® Index) U.S. Large Cap (S&P 500® Index)
Source: Fidelity Institutional Asset Management, 2018. Past performance is no guarantee of future results. Not intended to represent the performance of any Fidelity fund.
All market indices are unmanaged. It is not possible to invest directly in an index.
Investors should seek to diversify across both equity styles.
History suggests that proper diversification can help protect
investors from extended periods of underperformance, due to
the changing fortunes of value and growth-oriented managers.
Owning a mixed portfolio of value and growth stocks can
temper overall portfolio volatility, help reduce anxiety due
to that volatility, and allow you to stay on course with your
investment plan.
Chapter 3: You Must Have Growth In Your Portfolio