
Page 114 - Live-cellanalysis handbook
P. 114
Live-Cell Analysis Handbook — Third Edition
The IncuCyte Live-Cell Analysis System automatically captures segmentation tools are used to identify active objects (cells)
and analyzes short-term, calcium flux kinetics for every active within each well. Based on the changing fluorescent intensity of
cell within each well of a 96-well plate using IncuCyte Stare each individual cell, intensity traces are displayed for every active
®
Mode Movie acquisition. Each scan consists of a 30-180 second cell in the culture. Scanning is typically completed once every
movie, captured at a rate of three frames per second, then 24 hrs. Once these data are collected, several automated metrics
distilled into a single range image to allow for simple viewing are calculated for each well and at each scan time, allowing for
and image processing. This image represents the range of simple visualization of changing metrics over the full time-course
intensities that are detected from each cell within the culture of the experiment (Figure 2).
over the specified scan time. Using this image, automated image
A Vessel view B Active object mask
Fluorescent range image
Active object mask
C Summary trace — Mean intensity over 3 minutes
®
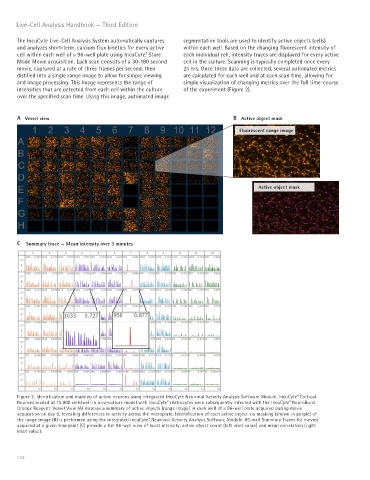
Figure 2. Identification and masking of active neurons using integrated IncuCyte Neuronal Activity Analysis Software Module. IncuCyte Cortical
Neurons seeded at 15,000 cells/well in a co-culture model with IncuCyte rAstrocytes were subsequently infected with the IncuCyte NeuroBurst
®
®
Orange Reagent. Vessel View (A) displays a summary of active objects (range image) in each well of a 96-well plate acquired during movie
acquisition on day 8, revealing differences in activity across the microplate. Identification of each active object via masking (shown in purple) of
the range image (B) is performed using the integrated IncuCyte Neuronal Activity Analysis Software Module. 96-well Summary Traces for movies
®
acquired at a given timepoint (C) provide a full 96-well view of burst intensity, active object count (left inset value) and mean correlation (right
inset value).
112