
Page 366 - The Veterinary Laboratory and Field Manual 3rd Edition
P. 366
Clinical chemistry 335
• The required graph is prepared by plotting the colour range absorption recommended in the
absorbance (OD) values obtained against the protocol selected for a particular test.
known concentration of the standard reagent. • Equipment should be calibrated using a con-
trol or standard reagent and a ‘blank’ sample
If there is a linear relationship between the prior to running the test.
concentration of a test reagent and colour • As part of the quality control process, every
absorption (OD) then the concentration of the batch of samples for a biochemistry test must
test substance is directly proportional to the be run along with standard controls, that is, a
colour intensity of the solution. However, in known positive and a known negative control.
most cases the relationship will be exponential In the case of quantitative tests, a dilution
(Figure 7.6) and there will only be a specific area series of the known standard reagent should
on the linear part of the ‘standard curve’ where also be run.
accurate readings can be taken. In these cases,
very low or high values may not be valid and
concentrated solutions or samples should be quality assessment
diluted and re-tested.
It is standard procedure to periodically send
duplicate serum/plasma samples to other lab-
Summary oratories for biochemical tests to check that
laboratory results are reliable. It is also impor-
• The colorimetry equipment used must be set tant to run an internal quality control scheme by
at the correct wavelength to read the specific keeping a record of all test results and preparing
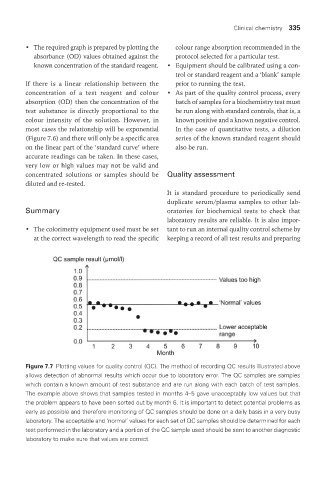
Figure 7.7 Plotting values for quality control (QC). The method of recording QC results illustrated above
allows detection of abnormal results which occur due to laboratory error. The QC samples are samples
which contain a known amount of test substance and are run along with each batch of test samples.
The example above shows that samples tested in months 4–5 gave unacceptably low values but that
the problem appears to have been sorted out by month 6. It is important to detect potential problems as
early as possible and therefore monitoring of QC samples should be done on a daily basis in a very busy
laboratory. The acceptable and ‘normal’ values for each set of QC samples should be determined for each
test performed in the laboratory and a portion of the QC sample used should be sent to another diagnostic
laboratory to make sure that values are correct.
Vet Lab.indb 335 26/03/2019 10:26