
Page 367 - The Veterinary Laboratory and Field Manual 3rd Edition
P. 367
336 Susan C. Cork, Willy Schauwers and Roy Halliwell
a graph of ‘standard’ and/or ‘control’ values to values are representative is it also useful to run
make sure that the test procedure gives accu- through a few test samples, with values assessed
rate (representative) and precise (repeatable) by other laboratories, to make sure that the
results each time. Limits of acceptability are results fall within acceptable parameters. There
predetermined and if the values of ‘normal may be some variation in results between labo-
samples’ lie outside set limits (see Figure 7.7) ratories but if the samples tested are of good
it is important to check the methods used. In quality (that is, collected and stored correctly)
some cases, the tests may need to be repeated. the variation should be small if the same test
Quality Management Systems are discussed in procedures are followed.
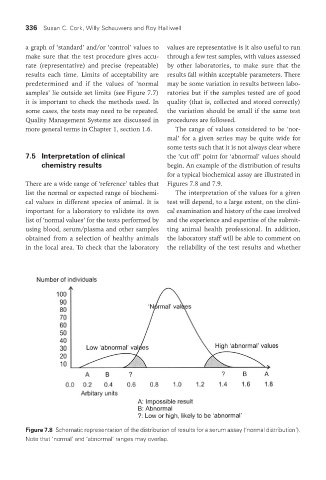
more general terms in Chapter 1, section 1.6. The range of values considered to be ‘nor-
mal’ for a given series may be quite wide for
some tests such that it is not always clear where
7.5 Interpretation of clinical the ‘cut off’ point for ‘abnormal’ values should
chemistry results begin. An example of the distribution of results
for a typical biochemical assay are illustrated in
There are a wide range of ‘reference’ tables that Figures 7.8 and 7.9.
list the normal or expected range of biochemi- The interpretation of the values for a given
cal values in different species of animal. It is test will depend, to a large extent, on the clini-
important for a laboratory to validate its own cal examination and history of the case involved
list of ‘normal values’ for the tests performed by and the experience and expertise of the submit-
using blood, serum/plasma and other samples ting animal health professional. In addition,
obtained from a selection of healthy animals the laboratory staff will be able to comment on
in the local area. To check that the laboratory the reliability of the test results and whether
Figure 7.8 Schematic representation of the distribution of results for a serum assay (‘normal distribution’).
Note that ‘normal’ and ‘abnormal’ ranges may overlap.
Vet Lab.indb 336 26/03/2019 10:26